> ## Documentation Index
> Fetch the complete documentation index at: https://docs.assetinfinity.ai/llms.txt
> Use this file to discover all available pages before exploring further.
# Dashboards
> Building your own boards of tiles and charts, arranging them, sharing them with people or roles, and having them emailed as a PDF or a spreadsheet on a schedule.
**Dashboards** is where you open, build and share boards of tiles and charts that you arrange
yourself — a weekly board pack for a meeting, the figures one site is judged on, or a single chart
you want to keep an eye on.
If you don't see this in your navigation, your administrator can switch the module on under **Administration → Modules**, or it may not be included in your plan.
The module is called **Dashboard builder** on the Features screen, and it is separate from the
**Report builder**: an organisation can have one without the other. **Dashboards** sits under
**Analytics** in the sidebar, beside [Reports](/analytics/reports) and [Copilot](/analytics/copilot).
The three boards on **Today** — My work, Operations and Executive — are built into the product and
are described in [Today's dashboards](/get-started/dashboards). The boards on this screen are the
ones your organisation composes. You can copy any of them and change the copy.
## Every figure is counted with your own access
This is the most important thing to understand about a dashboard, and the screen says it in the
first line.
Every widget on a board is counted with the access of the person looking at it — their site access,
their asset scope and their permissions. Two people opening the same shared board can honestly see
two different numbers, and neither of them is seeing anything they could not already open
elsewhere in the product.
**Sharing a board decides whose list it appears in. It never decides what it may show.** A board
cannot show a colleague a figure they could not count for themselves.
The one exception is a board sent on a schedule. Nobody is reading it at the moment it is drawn, so
it is counted with the **owner's** access instead, and the emailed copy says whose. See
[Sending a board on a schedule](#sending-a-board-on-a-schedule).
## Who can do what
| Permission (in plain words) | What it lets you do | Held by default by |
| - | - | - |
| View dashboards | Open this screen and read any board shared with you or with everybody | Every operational role, including technicians and procurement users |
| Create dashboards | **New dashboard**, **Duplicate**, **Arrange** your own boards, add and edit widgets, keep a Copilot chart on a board | Supervisors, planners, managers, executives and administrators |
| Share dashboards | **Share** your own boards and **Send it on a schedule** | Supervisors, planners, managers, executives and administrators |
Permissions belong to roles, and roles are edited under **Administration → Access** — see
[Roles](/setup/roles). Only a board's owner can arrange, share or delete it, whatever their
permissions; everybody else duplicates it.
## The dashboards list
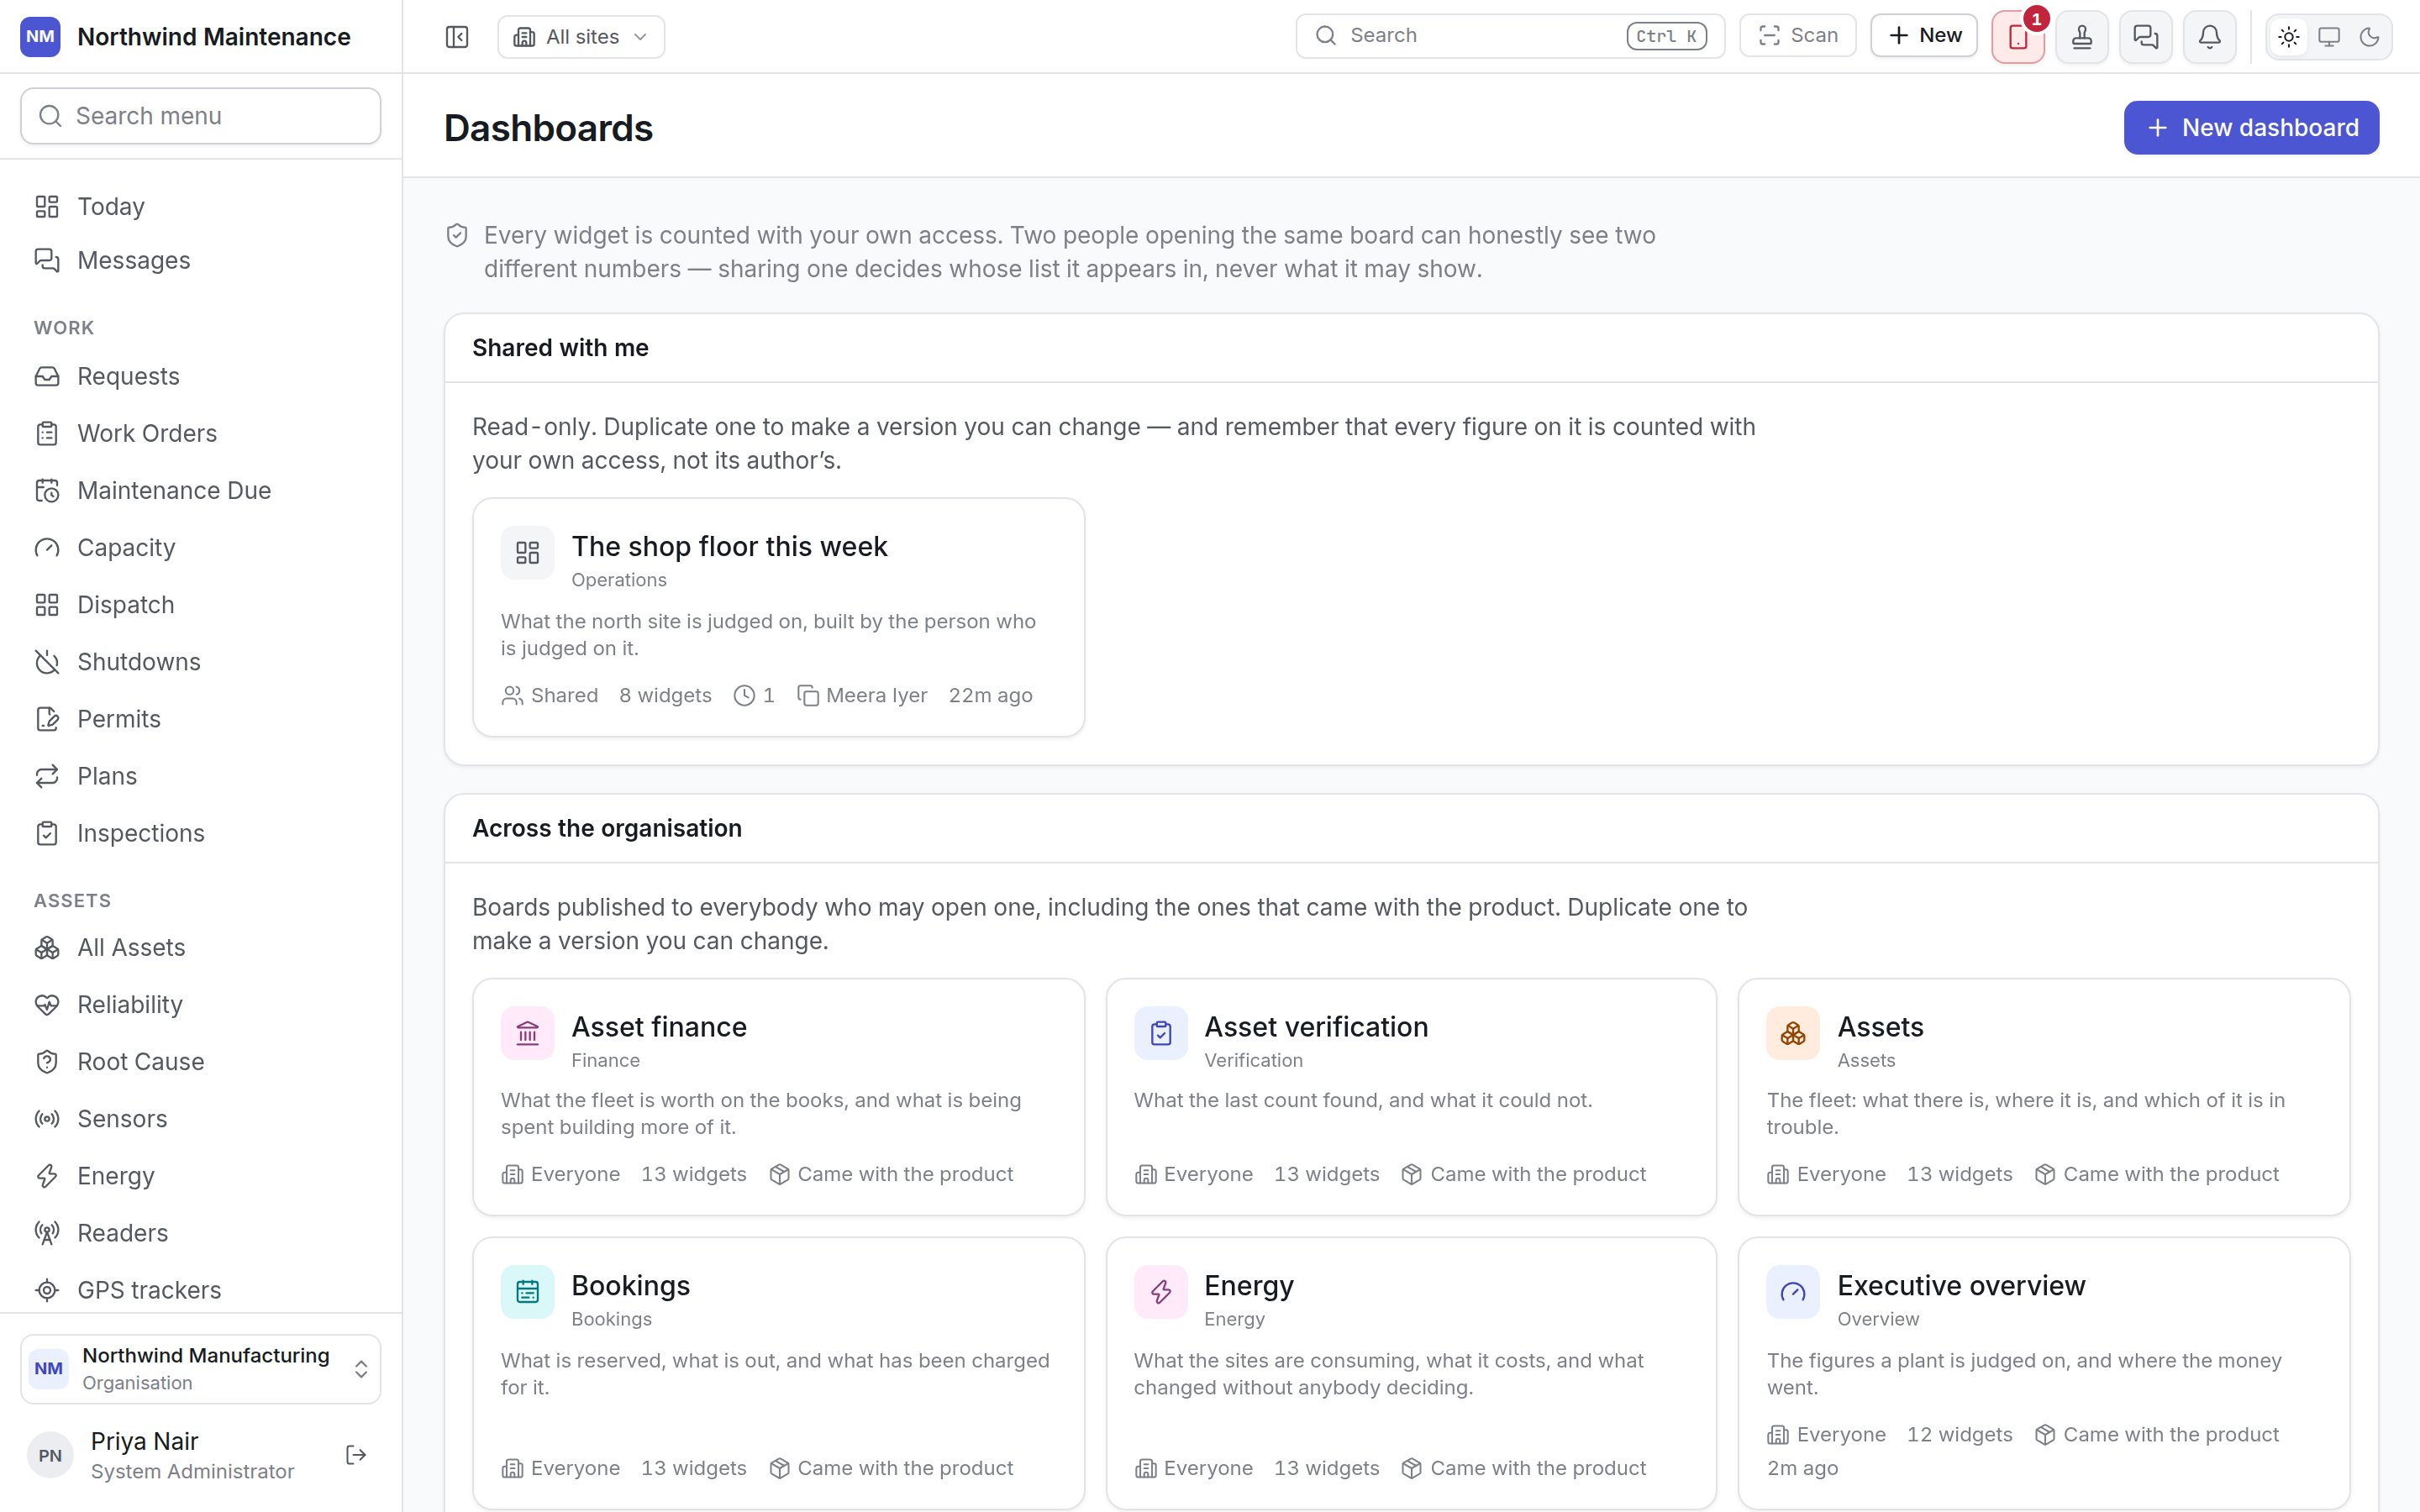
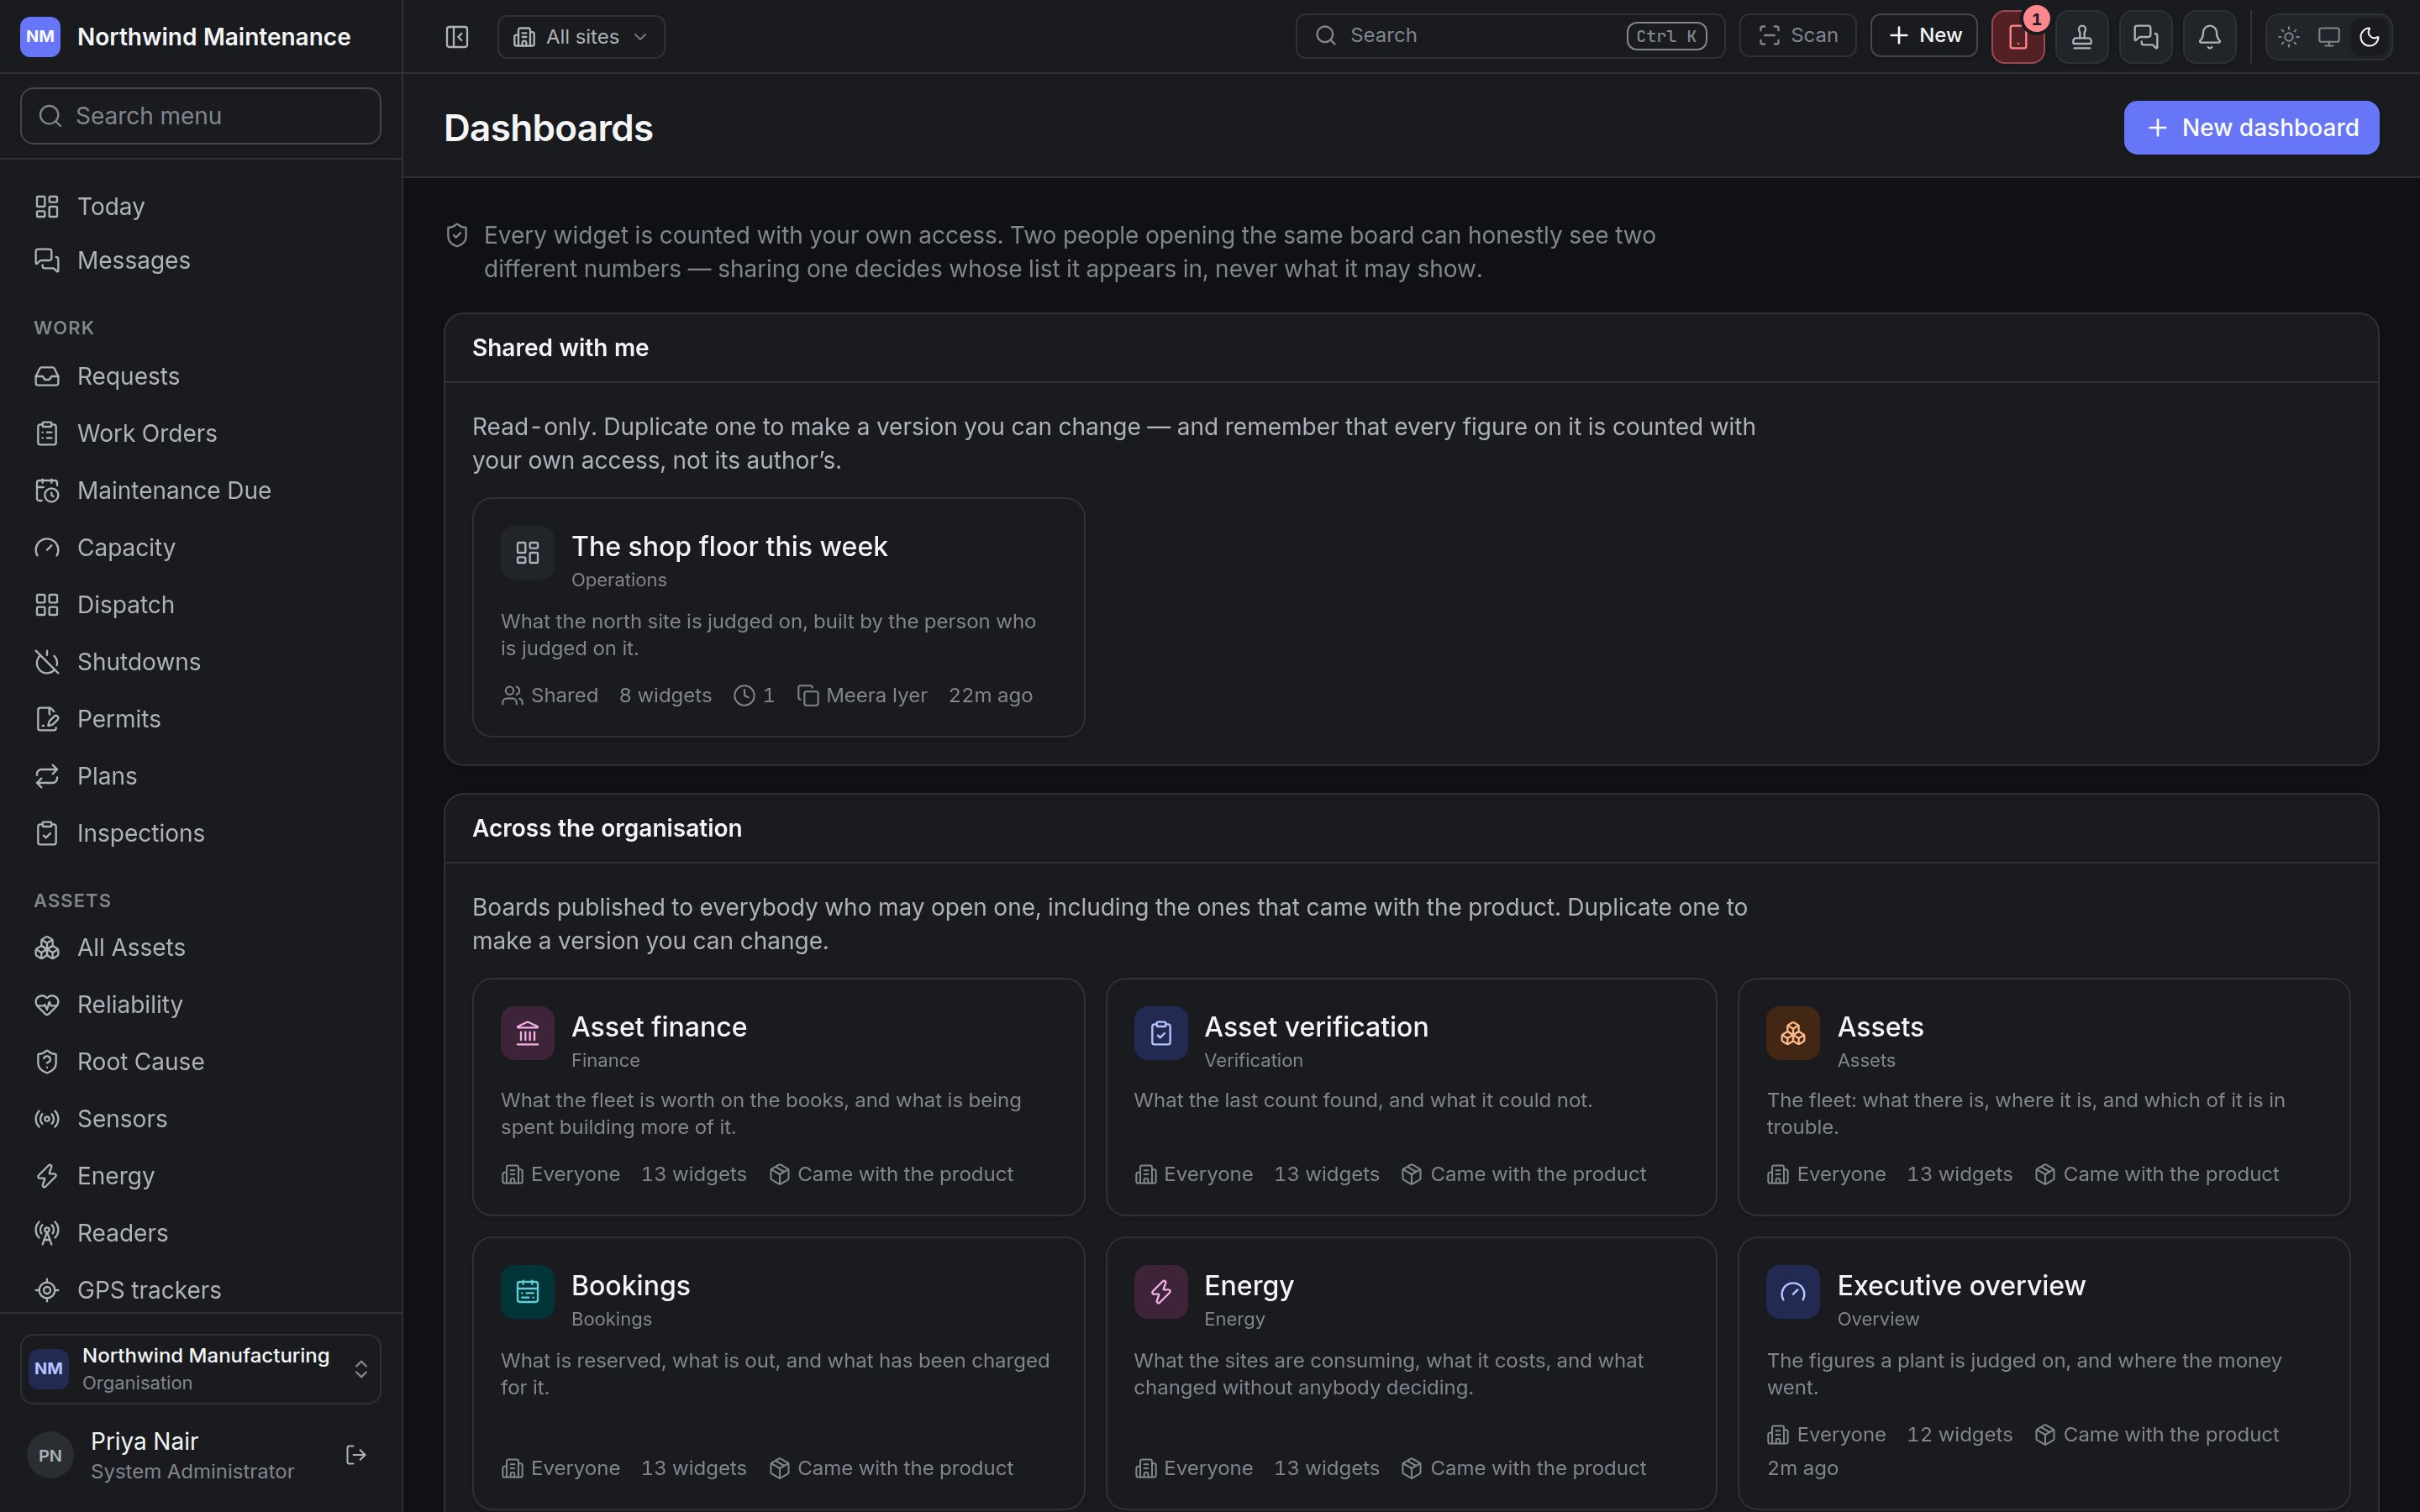 Boards are filed on up to three shelves. A board appears on one shelf only — the narrowest that fits
— and a shelf with nothing on it is not shown.
| Shelf | What is on it | What you can do with a board here |
| - | - | - |
| **Mine** | Boards you built. "Yours to change, and yours to share." | Everything: arrange, share, schedule, delete |
| **Shared with me** | Boards somebody shared with you by name or through one of your roles | Read, print and duplicate. Read-only otherwise |
| **Across the organisation** | Boards published to everybody who may open a dashboard, including the ones that came with the product | Read, print and duplicate |
### What a card shows
| On the card | What it means |
| - | - |
| Coloured mark and category | What the board is about. The mark follows the board's category — Work, Maintenance, Assets, Inventory, Purchasing, People, Overview, Reliability, Sensors, Energy, Bookings, Records, Verification, Vendors and contracts, Tools, Finance. A category the product does not recognise gets a neutral mark |
| **Draft** pill | The board has not been published. A draft is never sent on a schedule |
| Description | The board's own one-line summary, cut to two lines |
| **Only you**, **Shared** or **Everyone** | Who the board is shared with — see [Sharing a board](#sharing-a-board) |
| *n* **widgets** | How many tiles and charts are on it |
| Clock and a number | How many schedules send it. Absent when it is not scheduled |
| A person's name | Who owns a board that is not yours |
| **Came with the product** | One of the boards installed with the product. These have no owner on purpose, so that they belong to your organisation rather than to whoever set it up |
| A relative time | When you last opened it |
### The boards that come with the product
A new organisation starts with a set of boards published to everybody, one per area: **Asset
finance**, **Asset verification**, **Assets**, **Bookings**, **Energy**, **Executive overview**,
**Inventory**, **Lost and found**, **People and workload**, **Planned maintenance**,
**Purchasing**, **Reliability**, **Sensors**, **Tools**, **Vendors and contracts** and **Work
orders**. Each holds twelve or thirteen widgets. They cannot be rearranged in place; duplicate one to
make a version you can change.
## Creating a dashboard
**New dashboard** (top right) needs permission to create dashboards. It asks for one thing.
| Field | What it means | Notes |
| - | - | - |
| **Name** | What the board is called in everybody's list and at the top of a printed or emailed copy | Required. The example is "North site — this week" |
**Create** makes the board and opens it. It starts **private** and **empty** — "Add widgets, then
decide who it is for." Nobody else can see that it exists until you share it.
The other way to start is **Duplicate** on any board you can open. The copy is yours, private, and
opens straight away, with every widget of the original. This is how you change a board somebody
else owns, including the ones that came with the product.
## Reading a board
Boards are filed on up to three shelves. A board appears on one shelf only — the narrowest that fits
— and a shelf with nothing on it is not shown.
| Shelf | What is on it | What you can do with a board here |
| - | - | - |
| **Mine** | Boards you built. "Yours to change, and yours to share." | Everything: arrange, share, schedule, delete |
| **Shared with me** | Boards somebody shared with you by name or through one of your roles | Read, print and duplicate. Read-only otherwise |
| **Across the organisation** | Boards published to everybody who may open a dashboard, including the ones that came with the product | Read, print and duplicate |
### What a card shows
| On the card | What it means |
| - | - |
| Coloured mark and category | What the board is about. The mark follows the board's category — Work, Maintenance, Assets, Inventory, Purchasing, People, Overview, Reliability, Sensors, Energy, Bookings, Records, Verification, Vendors and contracts, Tools, Finance. A category the product does not recognise gets a neutral mark |
| **Draft** pill | The board has not been published. A draft is never sent on a schedule |
| Description | The board's own one-line summary, cut to two lines |
| **Only you**, **Shared** or **Everyone** | Who the board is shared with — see [Sharing a board](#sharing-a-board) |
| *n* **widgets** | How many tiles and charts are on it |
| Clock and a number | How many schedules send it. Absent when it is not scheduled |
| A person's name | Who owns a board that is not yours |
| **Came with the product** | One of the boards installed with the product. These have no owner on purpose, so that they belong to your organisation rather than to whoever set it up |
| A relative time | When you last opened it |
### The boards that come with the product
A new organisation starts with a set of boards published to everybody, one per area: **Asset
finance**, **Asset verification**, **Assets**, **Bookings**, **Energy**, **Executive overview**,
**Inventory**, **Lost and found**, **People and workload**, **Planned maintenance**,
**Purchasing**, **Reliability**, **Sensors**, **Tools**, **Vendors and contracts** and **Work
orders**. Each holds twelve or thirteen widgets. They cannot be rearranged in place; duplicate one to
make a version you can change.
## Creating a dashboard
**New dashboard** (top right) needs permission to create dashboards. It asks for one thing.
| Field | What it means | Notes |
| - | - | - |
| **Name** | What the board is called in everybody's list and at the top of a printed or emailed copy | Required. The example is "North site — this week" |
**Create** makes the board and opens it. It starts **private** and **empty** — "Add widgets, then
decide who it is for." Nobody else can see that it exists until you share it.
The other way to start is **Duplicate** on any board you can open. The copy is yours, private, and
opens straight away, with every widget of the original. This is how you change a board somebody
else owns, including the ones that came with the product.
## Reading a board
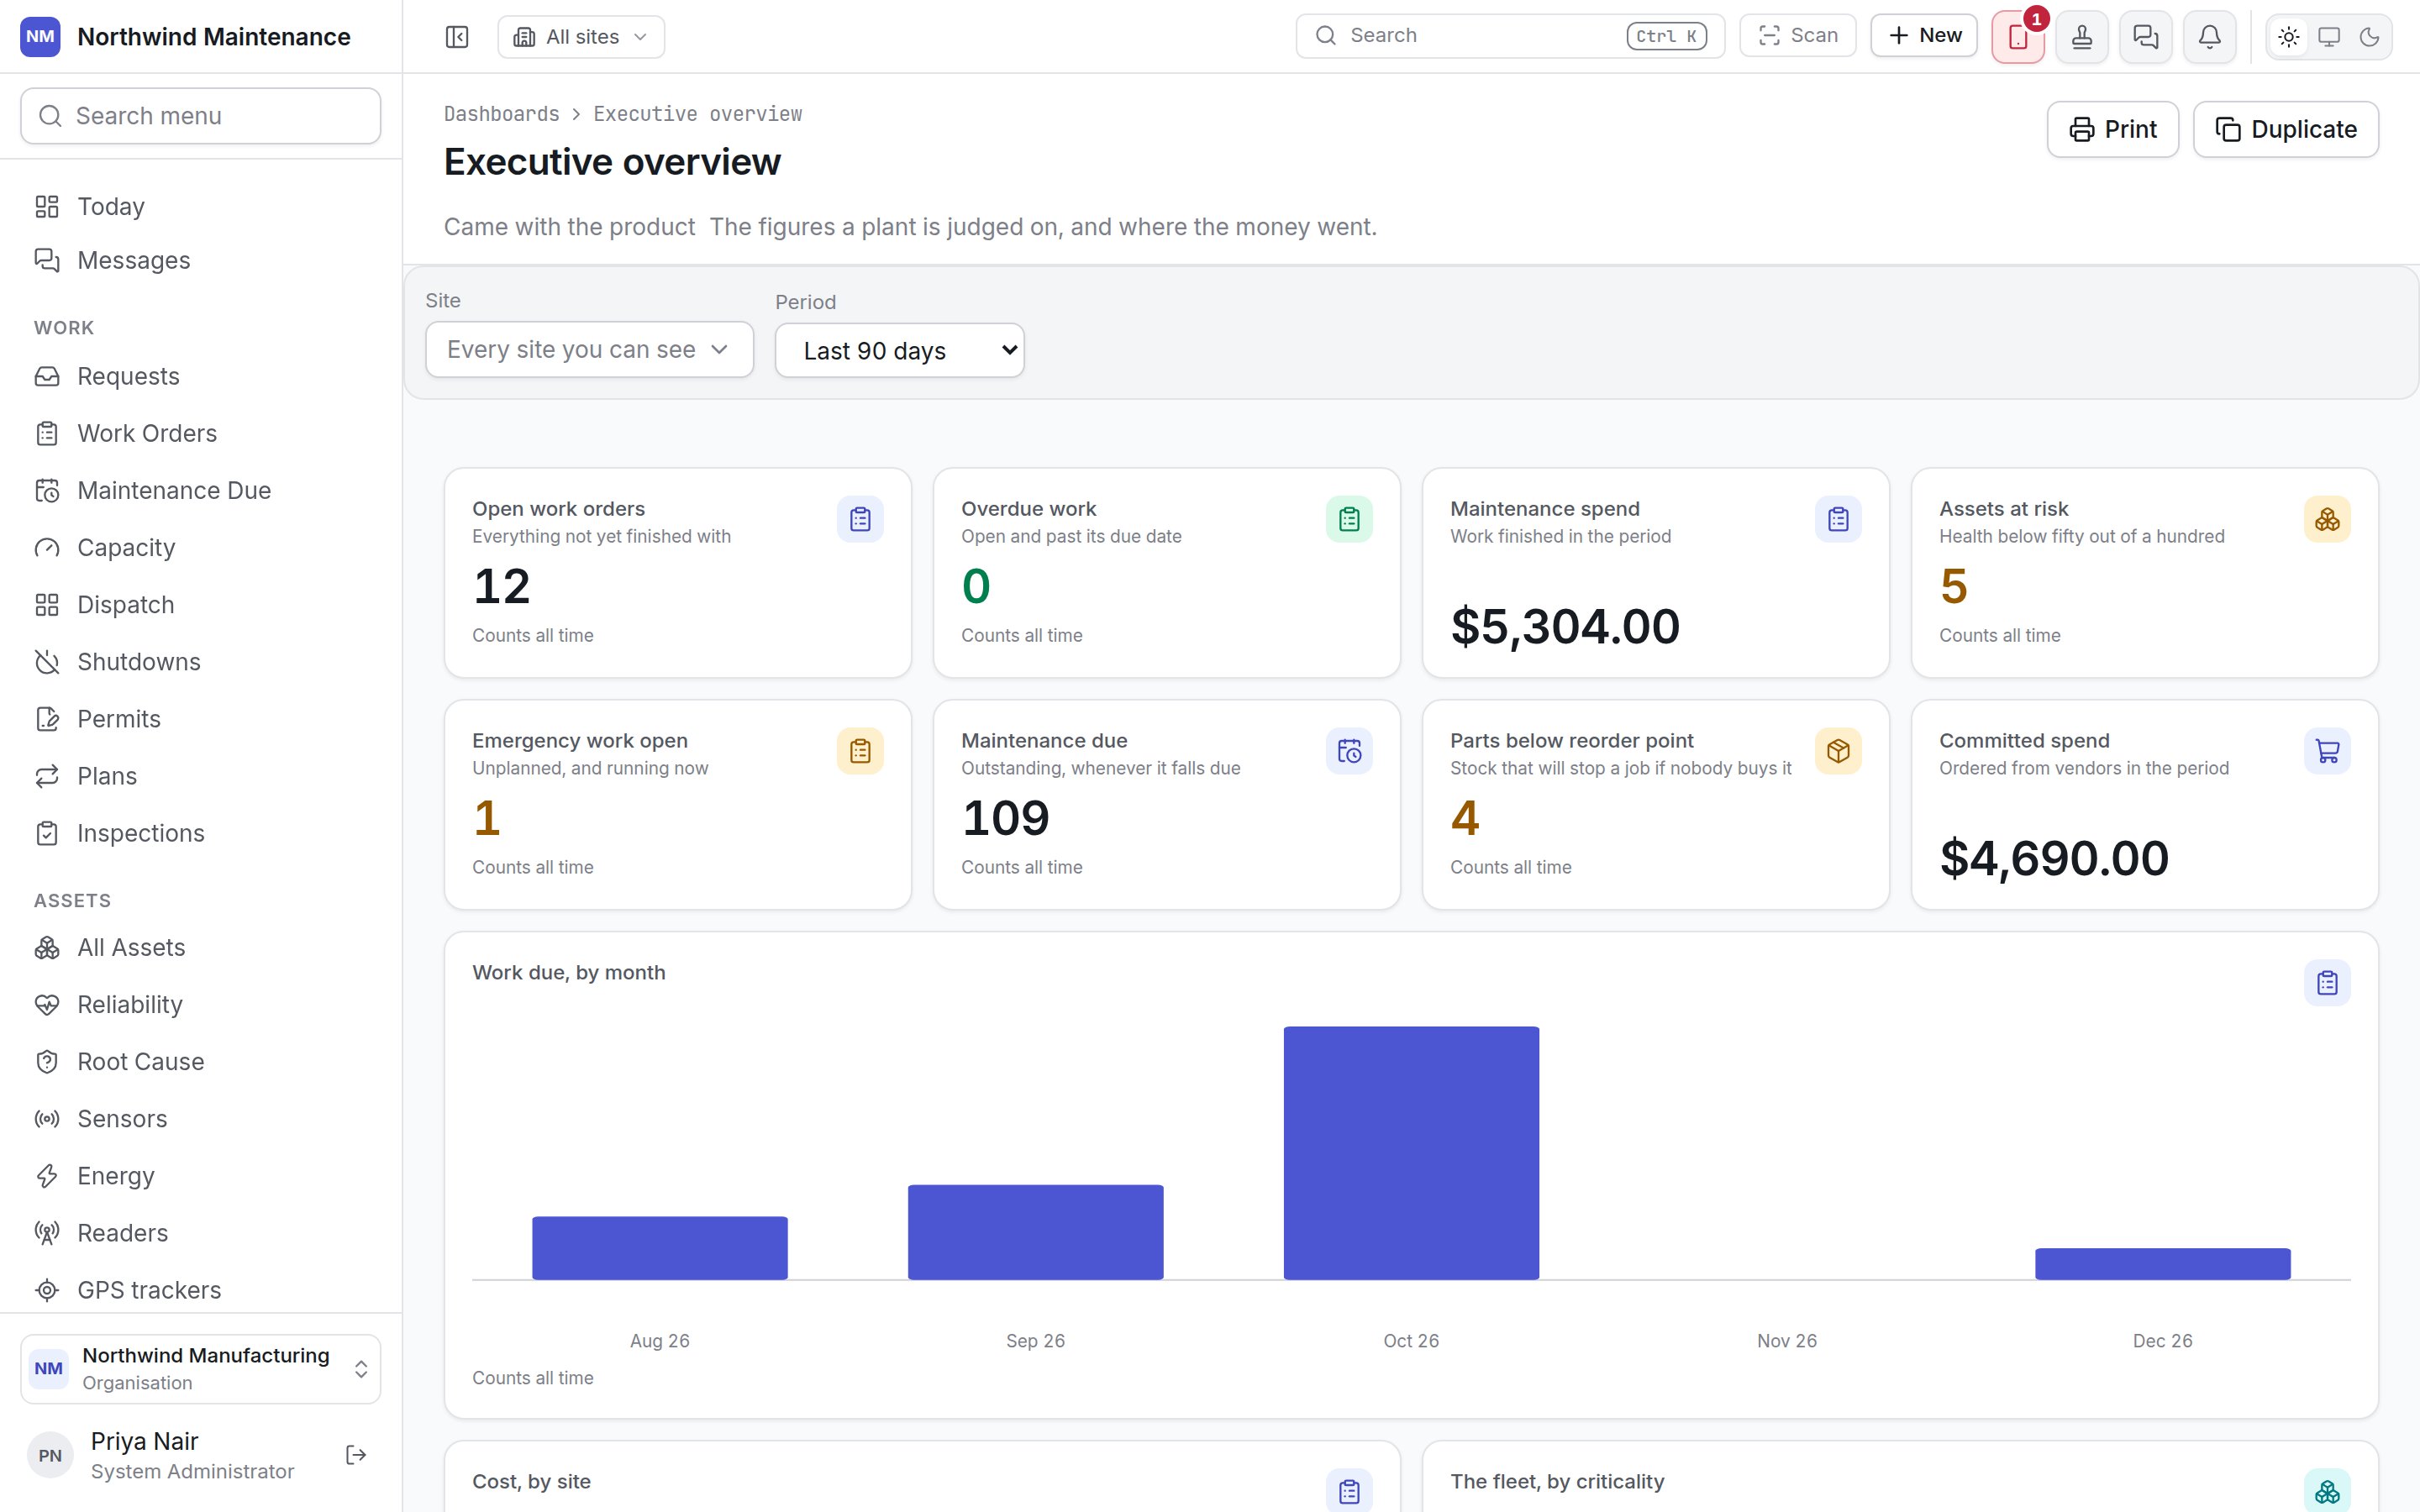
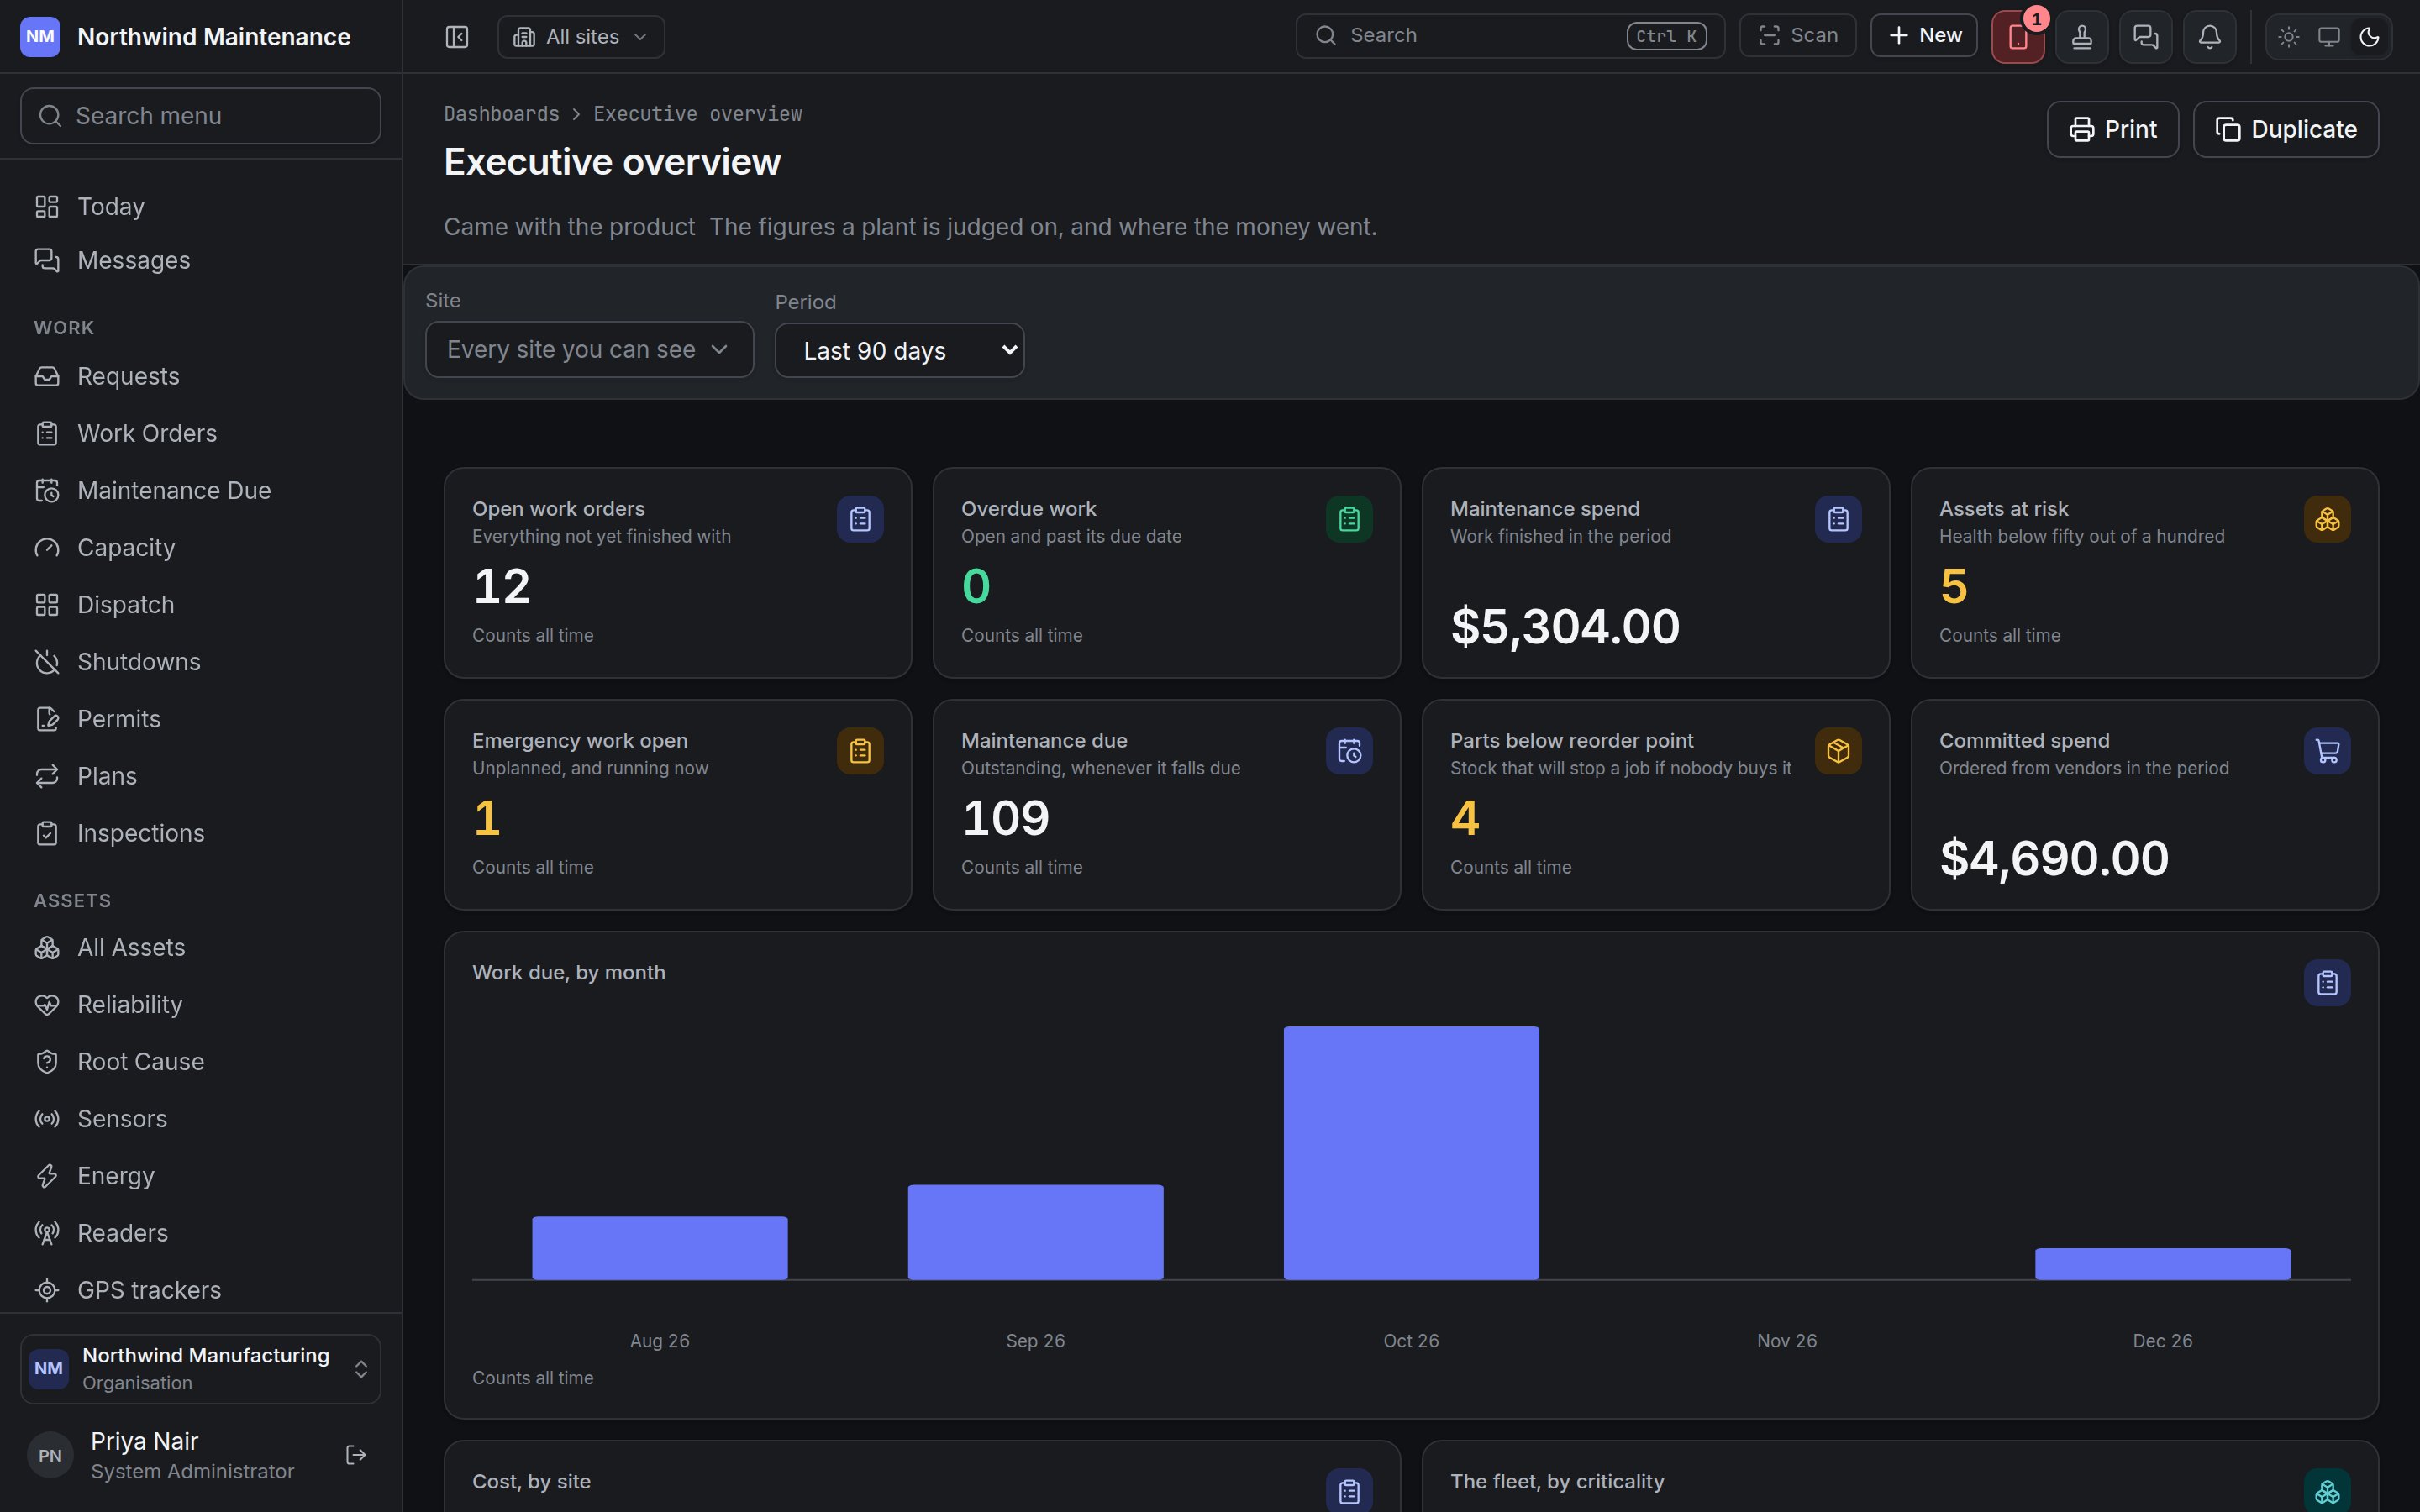 The header carries the board's name, a **Draft** pill if it is unpublished, its owner ("by Meera
Iyer") or **Came with the product**, and its description.
| Button | What it does | Who sees it |
| - | - | - |
| **Print** | Opens your browser's print dialog. The printed copy drops the menus and buttons, lets the tiles reflow to the page, and adds a line naming the site, the period, when it was printed and that it was counted with your own access | Everybody |
| **Duplicate** | Makes your own private copy and opens it | Anyone who may create dashboards |
| **Share** | Opens [Who is this dashboard for?](#sharing-a-board) | The owner, with permission to share |
| **Arrange** / **Done** | Switches the board into and out of editing | The owner, with permission to create |
### The filter bar: site and period
Above the tiles sit two controls.
| Control | What it means | Notes |
| - | - | - |
| **Site** | Narrows the board to one site | Defaults to the board's own default site, or **Every site you can see**. The options are the sites you have access to |
| **Period** | A look-back window the board is counted over | **Last 7 days**, **Last 30 days**, **Last 90 days**, **Last 12 months**, **This month**, **This quarter**, **This year**, **All time**. Defaults to the board's own default period, normally **Last 30 days** |
Your selection is for this visit only. It never changes the board itself, and it never changes what a
schedule sends.
The filter bar is a promise each widget has to opt into. A widget only follows the site and the
period through columns its author named for them (see [What the board's filter
reaches](#what-the-boards-filter-reaches)). A widget the selection does not reach says so on its own
face, in small text under the figure:
* **Counts all time** — you chose a period, and this widget is not filtered by period.
* **Counts every site** — you chose a site, and this widget is not filtered by site.
If you choose a site and no widget on the board is filtered by site, a sentence beside the filter bar
says so. The bar is hidden entirely on a board whose widgets all fix their own scope.
### Seeing the rows behind a figure
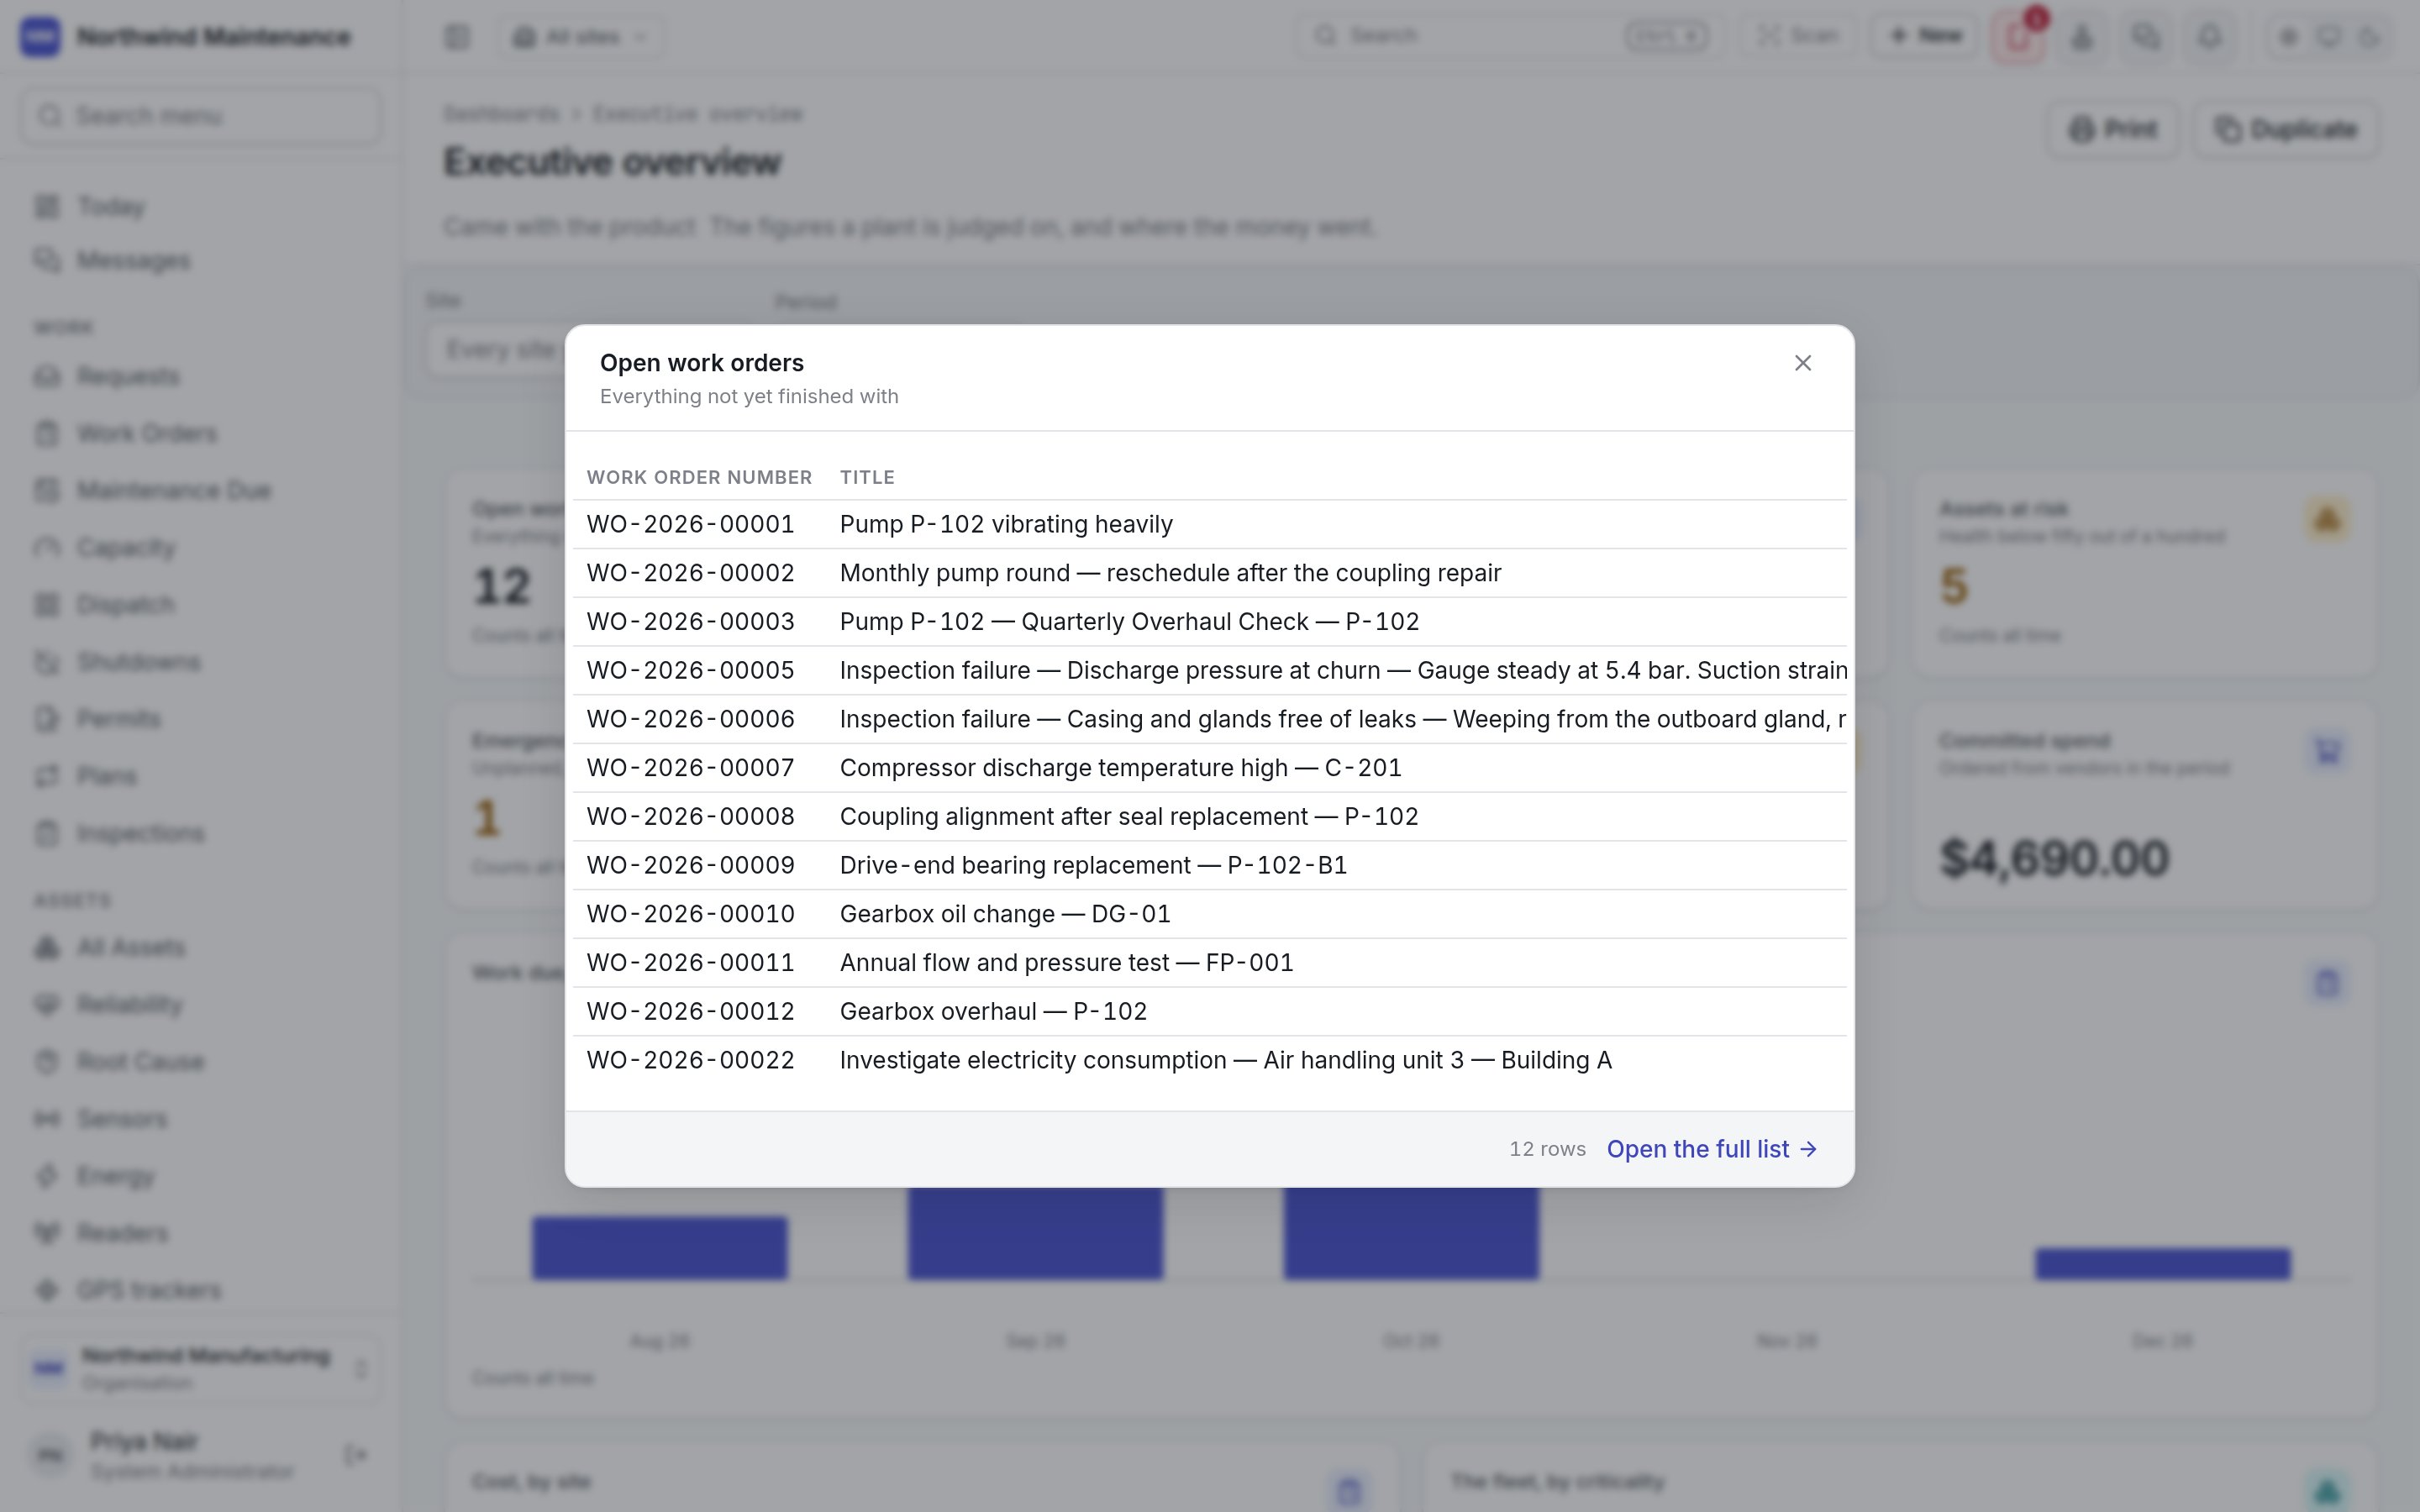
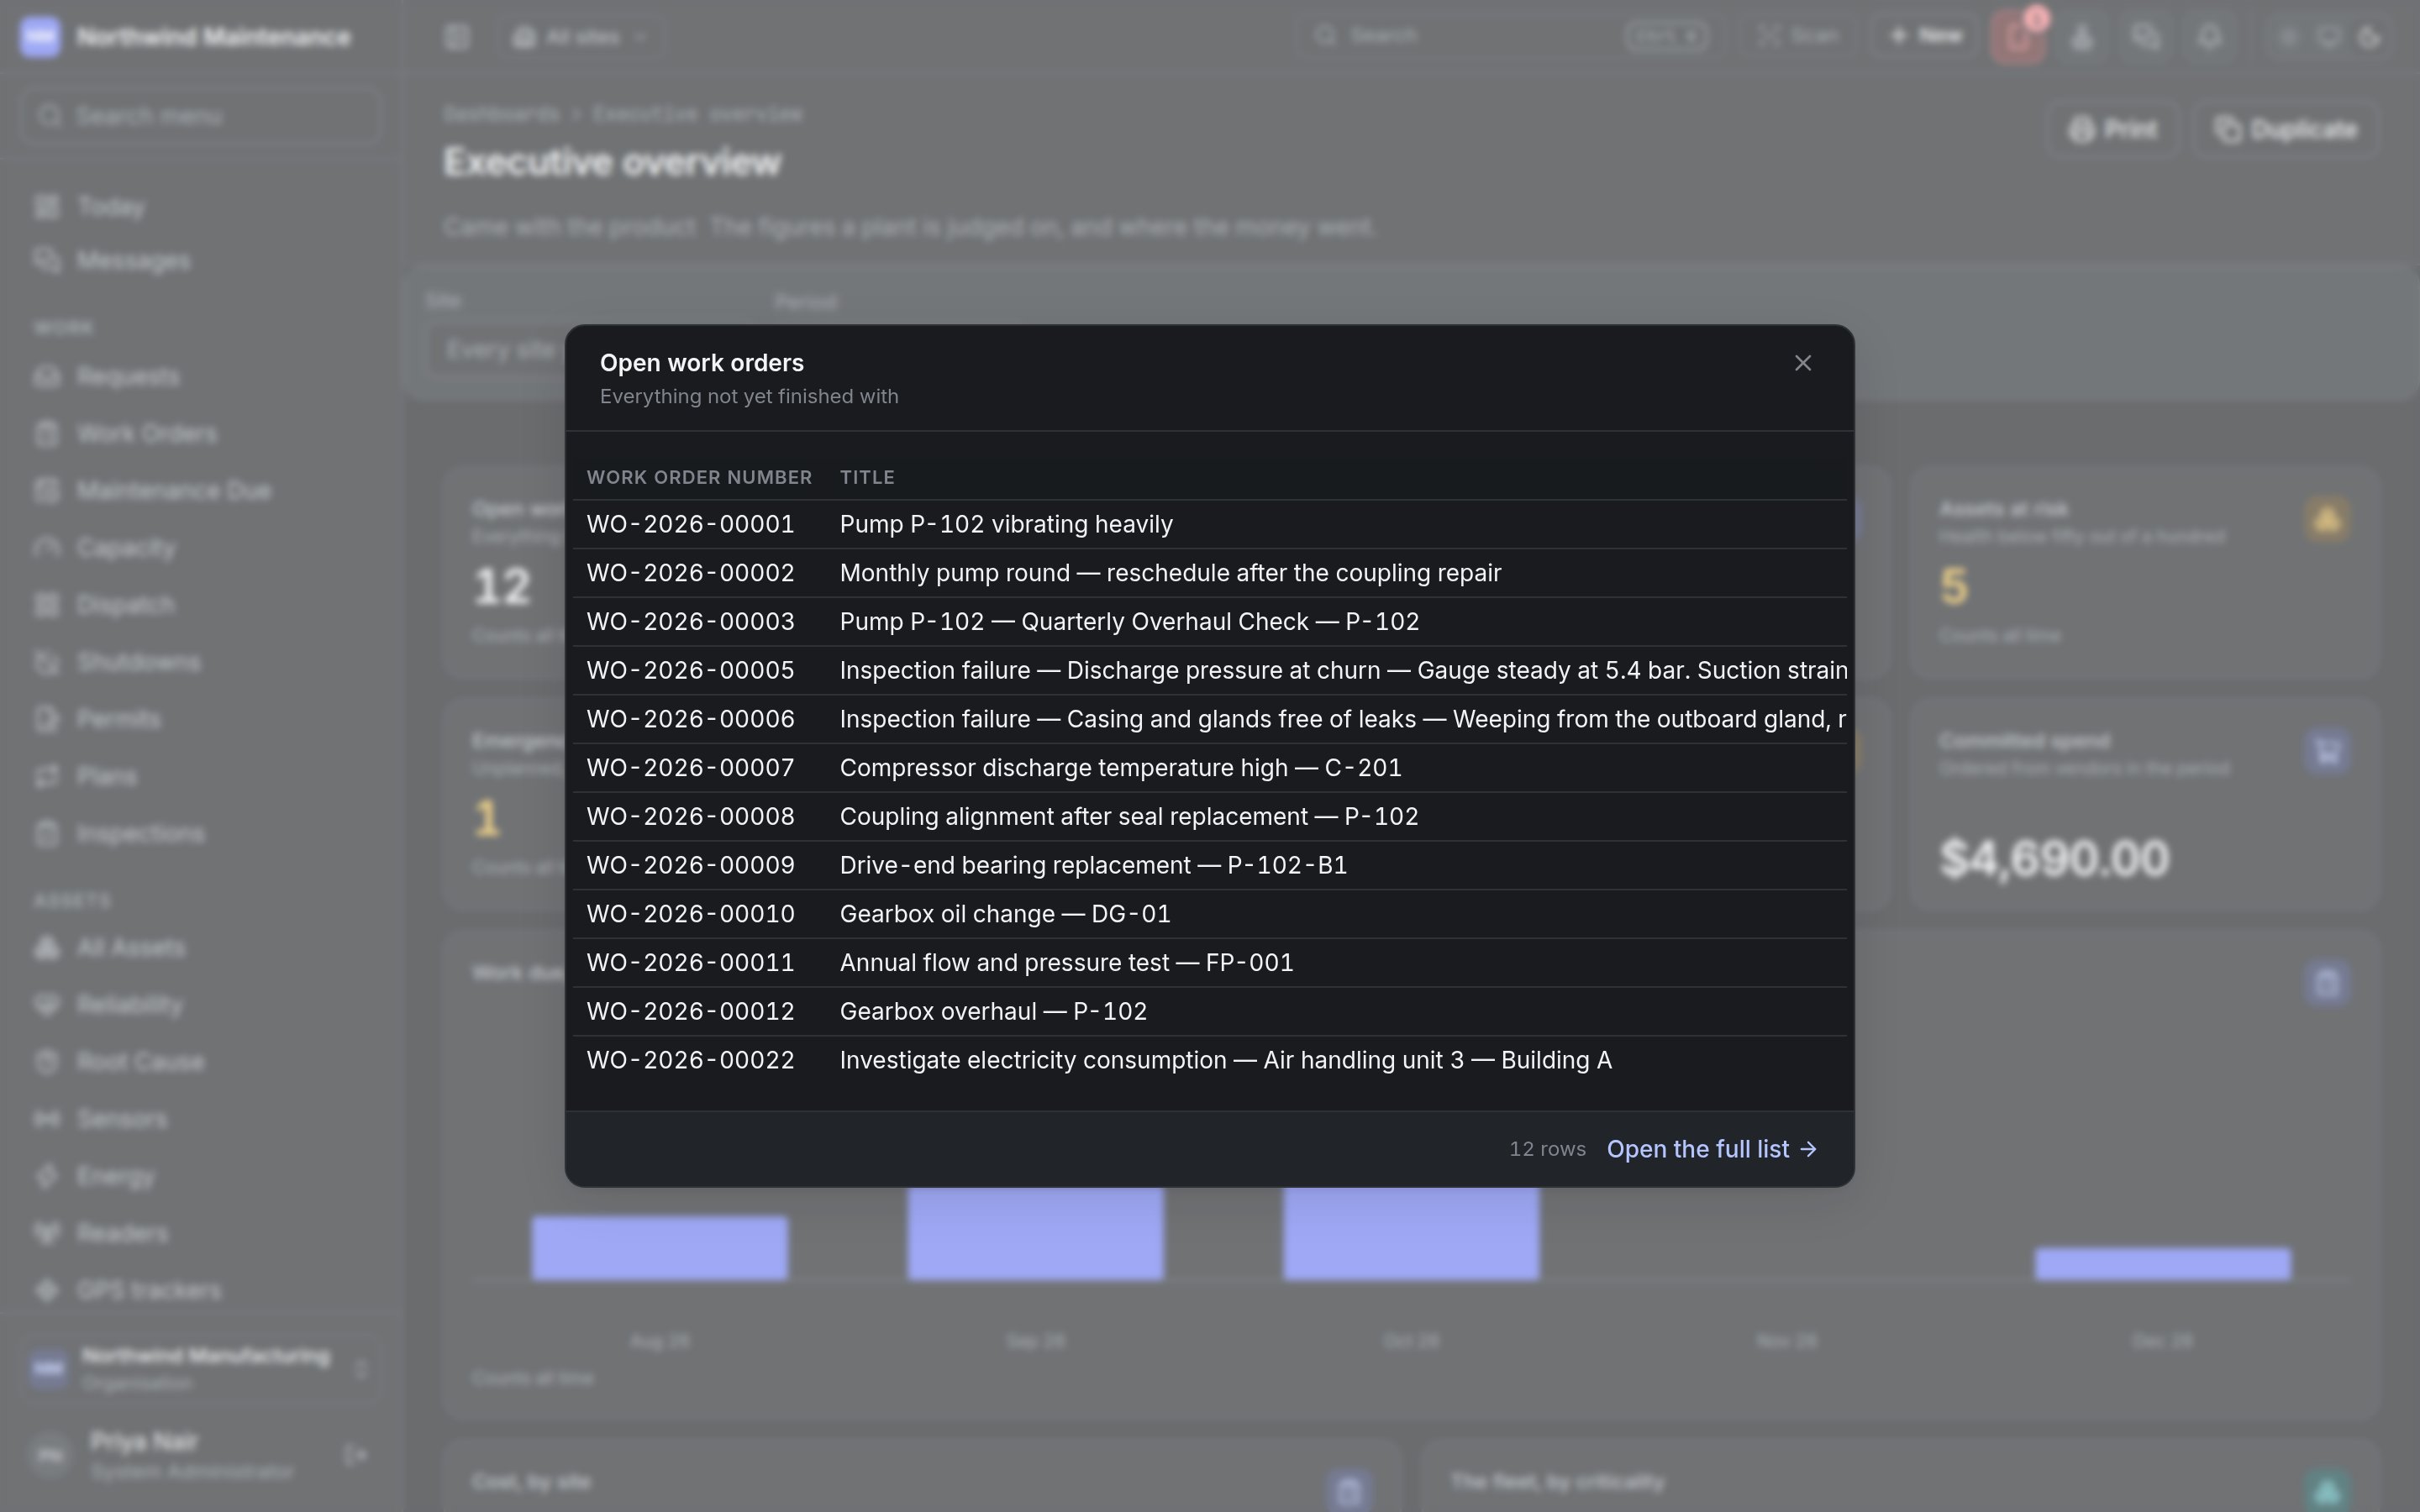
Click a tile or a bar and a window opens on **the rows behind it** — the records that make up that
number, as you are allowed to see them. A long list shows **The first** *n* rows; **Open the full
list**, where it is offered, takes you to the register the figure came from.
The header carries the board's name, a **Draft** pill if it is unpublished, its owner ("by Meera
Iyer") or **Came with the product**, and its description.
| Button | What it does | Who sees it |
| - | - | - |
| **Print** | Opens your browser's print dialog. The printed copy drops the menus and buttons, lets the tiles reflow to the page, and adds a line naming the site, the period, when it was printed and that it was counted with your own access | Everybody |
| **Duplicate** | Makes your own private copy and opens it | Anyone who may create dashboards |
| **Share** | Opens [Who is this dashboard for?](#sharing-a-board) | The owner, with permission to share |
| **Arrange** / **Done** | Switches the board into and out of editing | The owner, with permission to create |
### The filter bar: site and period
Above the tiles sit two controls.
| Control | What it means | Notes |
| - | - | - |
| **Site** | Narrows the board to one site | Defaults to the board's own default site, or **Every site you can see**. The options are the sites you have access to |
| **Period** | A look-back window the board is counted over | **Last 7 days**, **Last 30 days**, **Last 90 days**, **Last 12 months**, **This month**, **This quarter**, **This year**, **All time**. Defaults to the board's own default period, normally **Last 30 days** |
Your selection is for this visit only. It never changes the board itself, and it never changes what a
schedule sends.
The filter bar is a promise each widget has to opt into. A widget only follows the site and the
period through columns its author named for them (see [What the board's filter
reaches](#what-the-boards-filter-reaches)). A widget the selection does not reach says so on its own
face, in small text under the figure:
* **Counts all time** — you chose a period, and this widget is not filtered by period.
* **Counts every site** — you chose a site, and this widget is not filtered by site.
If you choose a site and no widget on the board is filtered by site, a sentence beside the filter bar
says so. The bar is hidden entirely on a board whose widgets all fix their own scope.
### Seeing the rows behind a figure
Click a tile or a bar and a window opens on **the rows behind it** — the records that make up that
number, as you are allowed to see them. A long list shows **The first** *n* rows; **Open the full
list**, where it is offered, takes you to the register the figure came from.
 ### How a tile tells you whether a figure is good
A tile whose author marked the figure as a verdict is coloured: green when it is on the good side of
its thresholds, amber past the amber threshold and red past the red one. A tile with a target names
it underneath ("Target 95%"), and a chart draws its target as a reference line. A tile that could
not be run says **This widget could not be run** rather than showing a blank, and a widget with no
rows says **Nothing to show.**
Under the board, **Sent on a schedule** lists the board's schedules and **What went out** lists what
was delivered — see [Sending a board on a schedule](#sending-a-board-on-a-schedule).
## Arranging a board
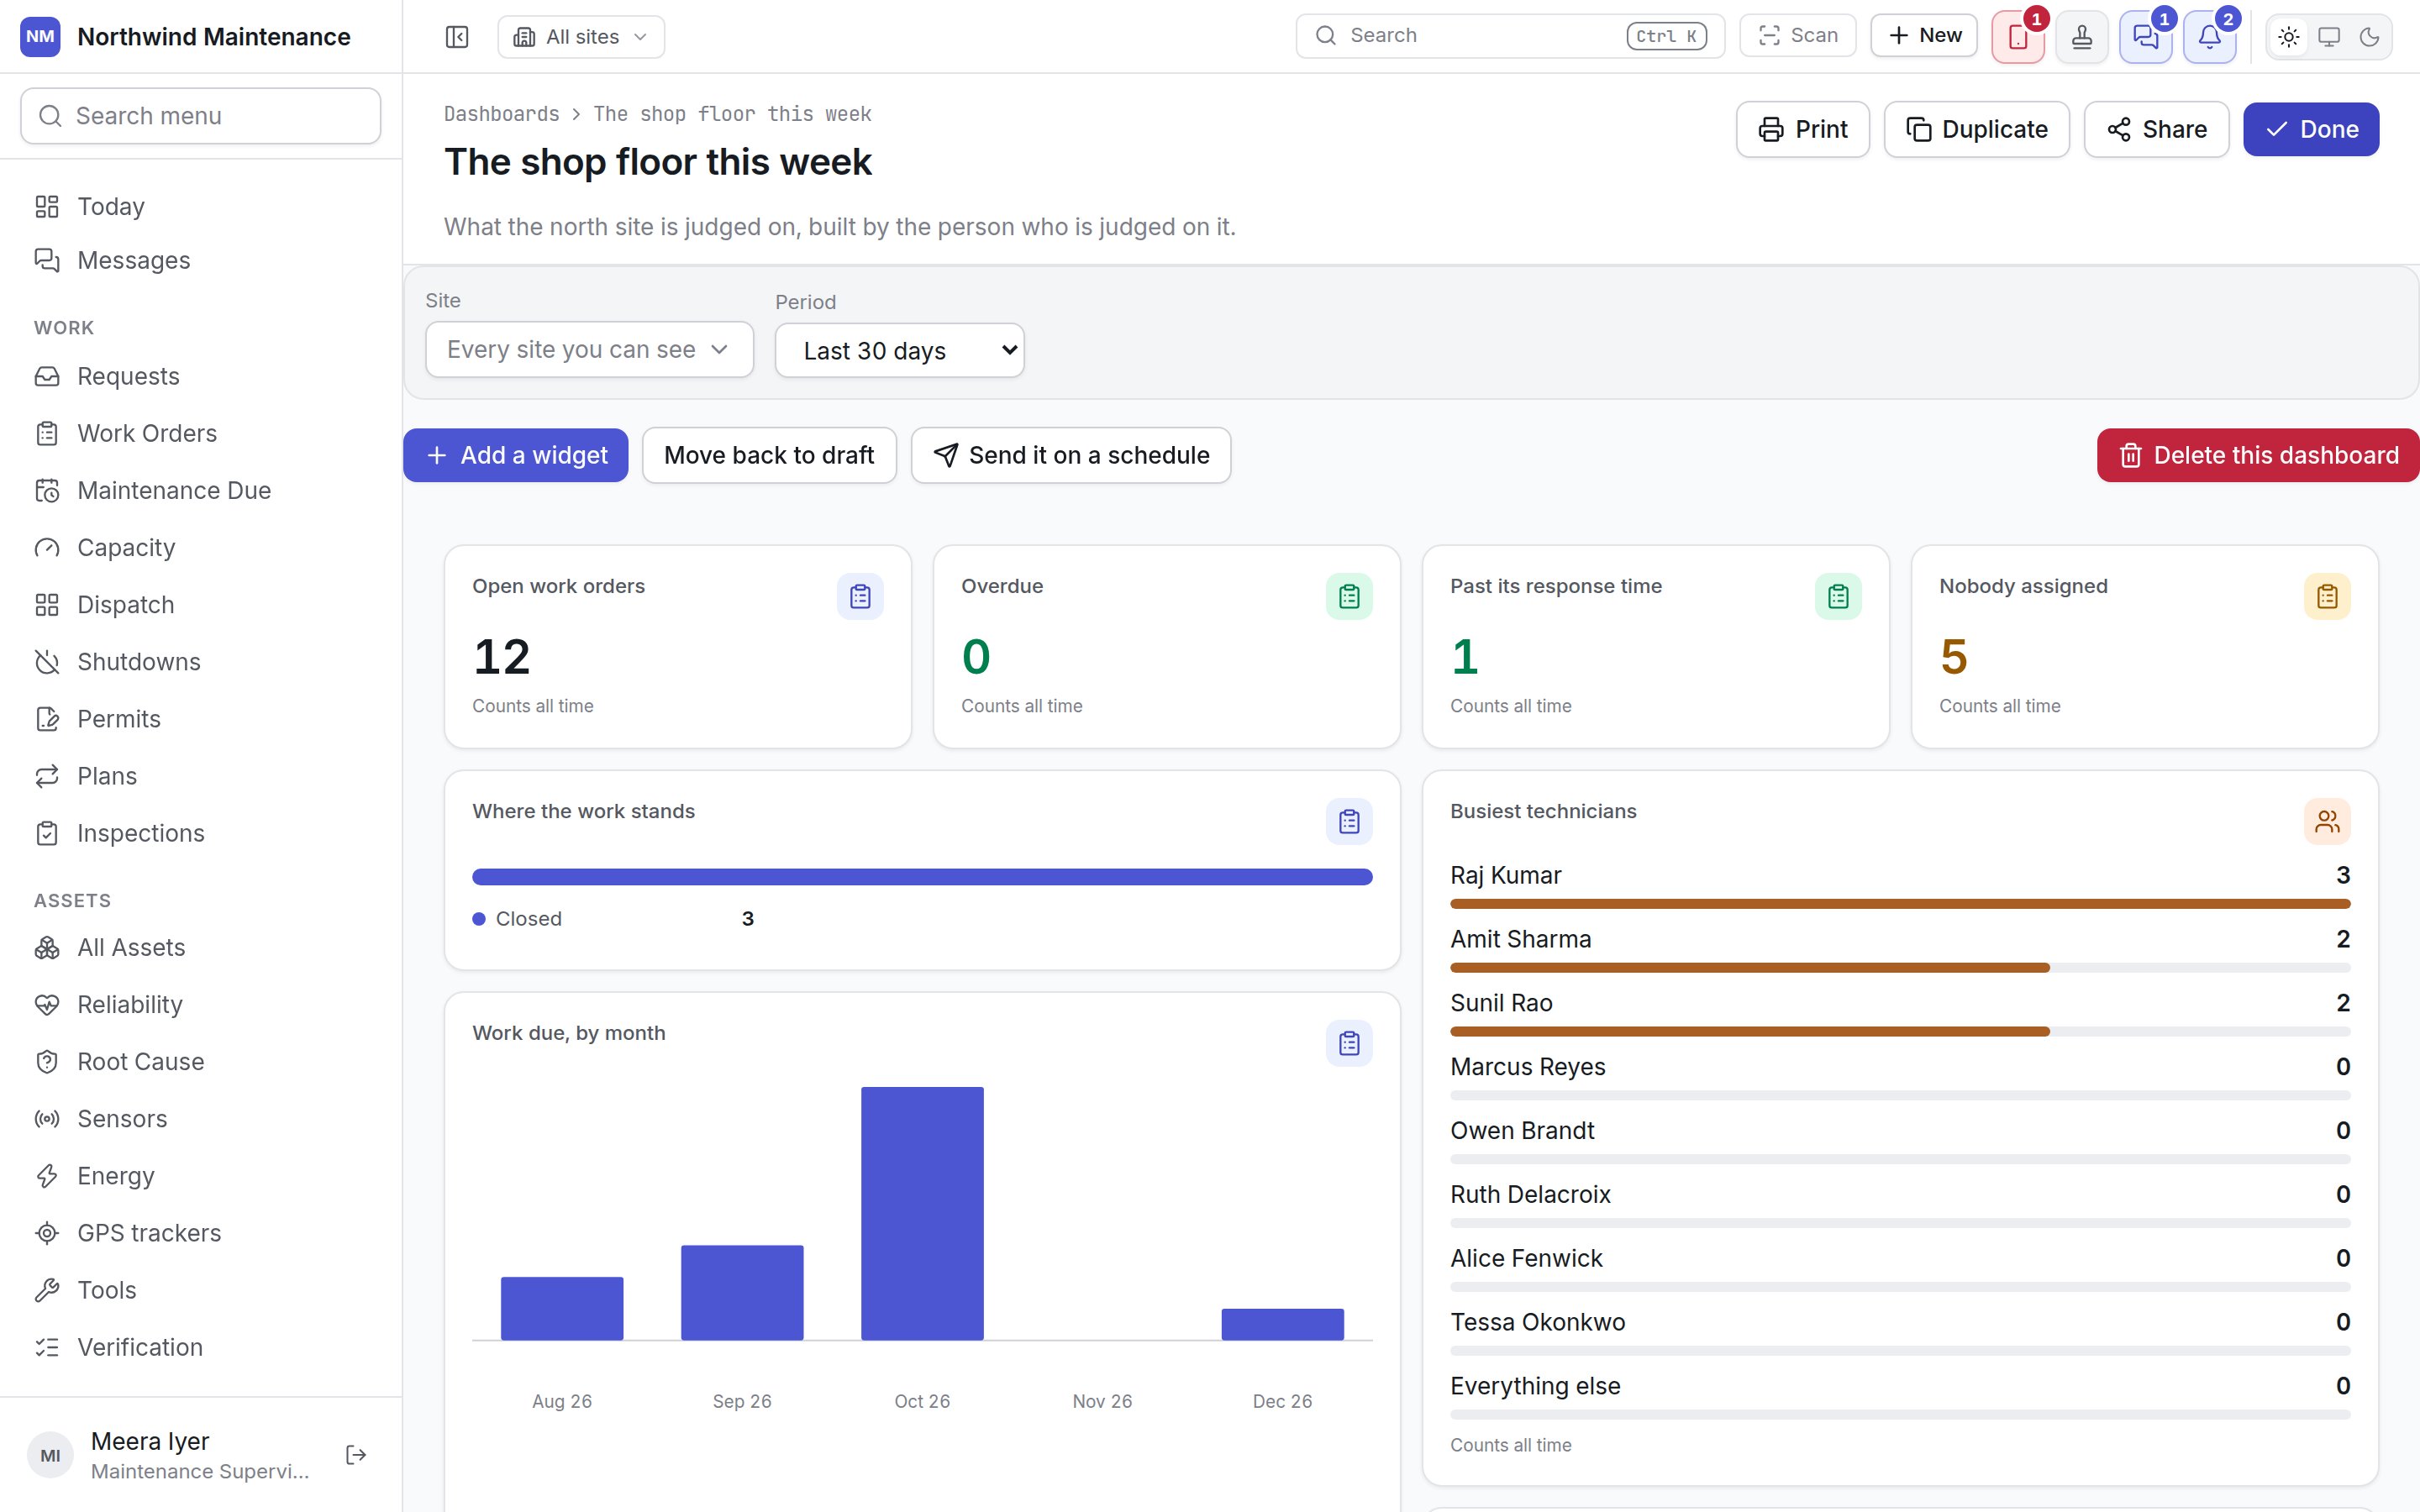
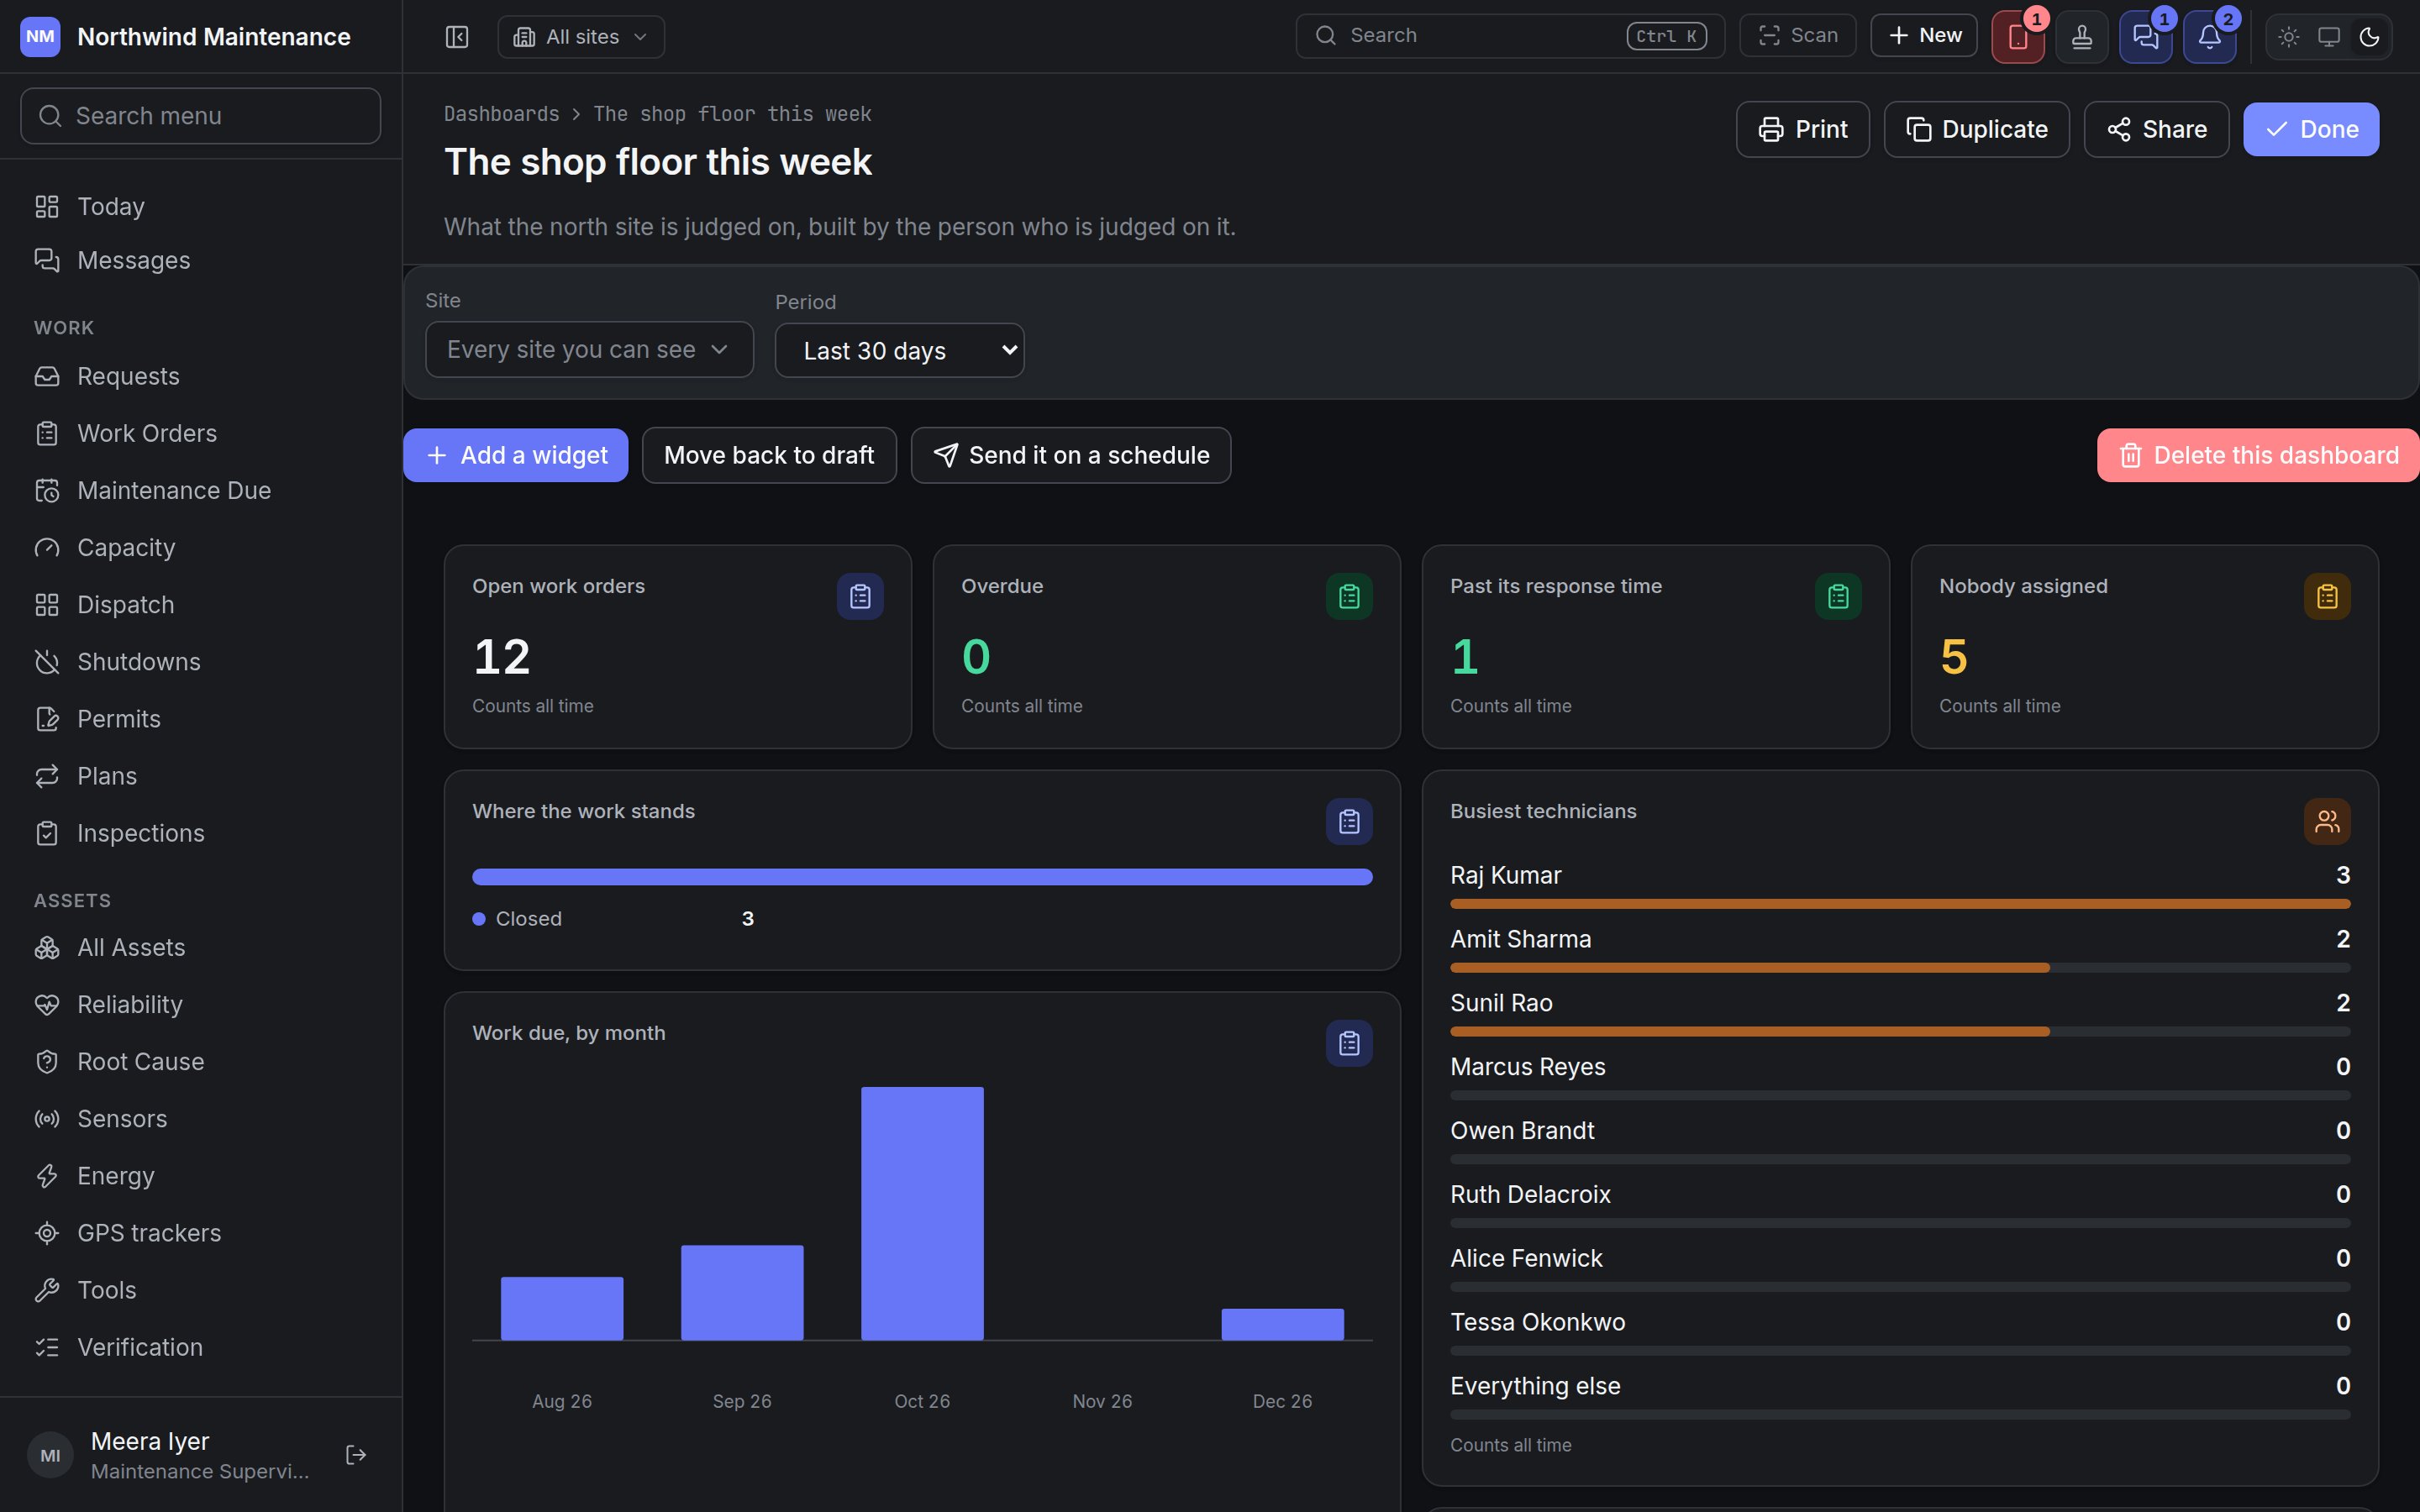
Open one of your own boards and press **Arrange**. A toolbar appears under the filter bar, and each
widget grows a row of controls when you point at it.
### How a tile tells you whether a figure is good
A tile whose author marked the figure as a verdict is coloured: green when it is on the good side of
its thresholds, amber past the amber threshold and red past the red one. A tile with a target names
it underneath ("Target 95%"), and a chart draws its target as a reference line. A tile that could
not be run says **This widget could not be run** rather than showing a blank, and a widget with no
rows says **Nothing to show.**
Under the board, **Sent on a schedule** lists the board's schedules and **What went out** lists what
was delivered — see [Sending a board on a schedule](#sending-a-board-on-a-schedule).
## Arranging a board
Open one of your own boards and press **Arrange**. A toolbar appears under the filter bar, and each
widget grows a row of controls when you point at it.
 | Toolbar button | What it does |
| - | - |
| **Add a widget** | Opens the widget editor, below |
| **Publish** / **Move back to draft** | A published board can be sent on a schedule; a draft cannot. Publishing does not change who can see the board — sharing does that |
| **Send it on a schedule** | Opens [Send this dashboard](#sending-a-board-on-a-schedule). Needs permission to share dashboards |
| **Delete this dashboard** | Deletes the board, its widgets and its schedules, and returns you to the list |
**Delete this dashboard** and a widget's **Remove widget** act at once — there is no confirmation
step. If you only want to stop a board being sent, edit its schedule instead.
### The controls on each widget
A board is a reading order and a width, not a free canvas. Widgets fill a twelve-column grid from
left to right and wrap, so the same board reads correctly on a laptop, on a phone and on a printed
page. Nothing can overlap and no gap is left behind when you remove a widget.
| Control | What it does |
| - | - |
| Grip | Drag the widget to a new place in the order |
| **Move earlier** / **Move later** | The same as dragging, one place at a time — for a keyboard or a touch screen |
| **Narrower** / **Wider** | Steps the width through a quarter, a third, a half, two thirds and the full width of the board |
| **Taller** (shows 1×, 2× or 3×) | Cycles the widget through one, two and three rows high |
| **Remove widget** | Deletes the widget straight away |
| Click anywhere on the widget | Opens it in the widget editor |
On a narrow screen a widget may be drawn wider than you arranged it, so its figure stays readable.
It is never drawn narrower.
Press **Done** to leave Arrange mode. Every change is saved as you make it.
## Building a widget
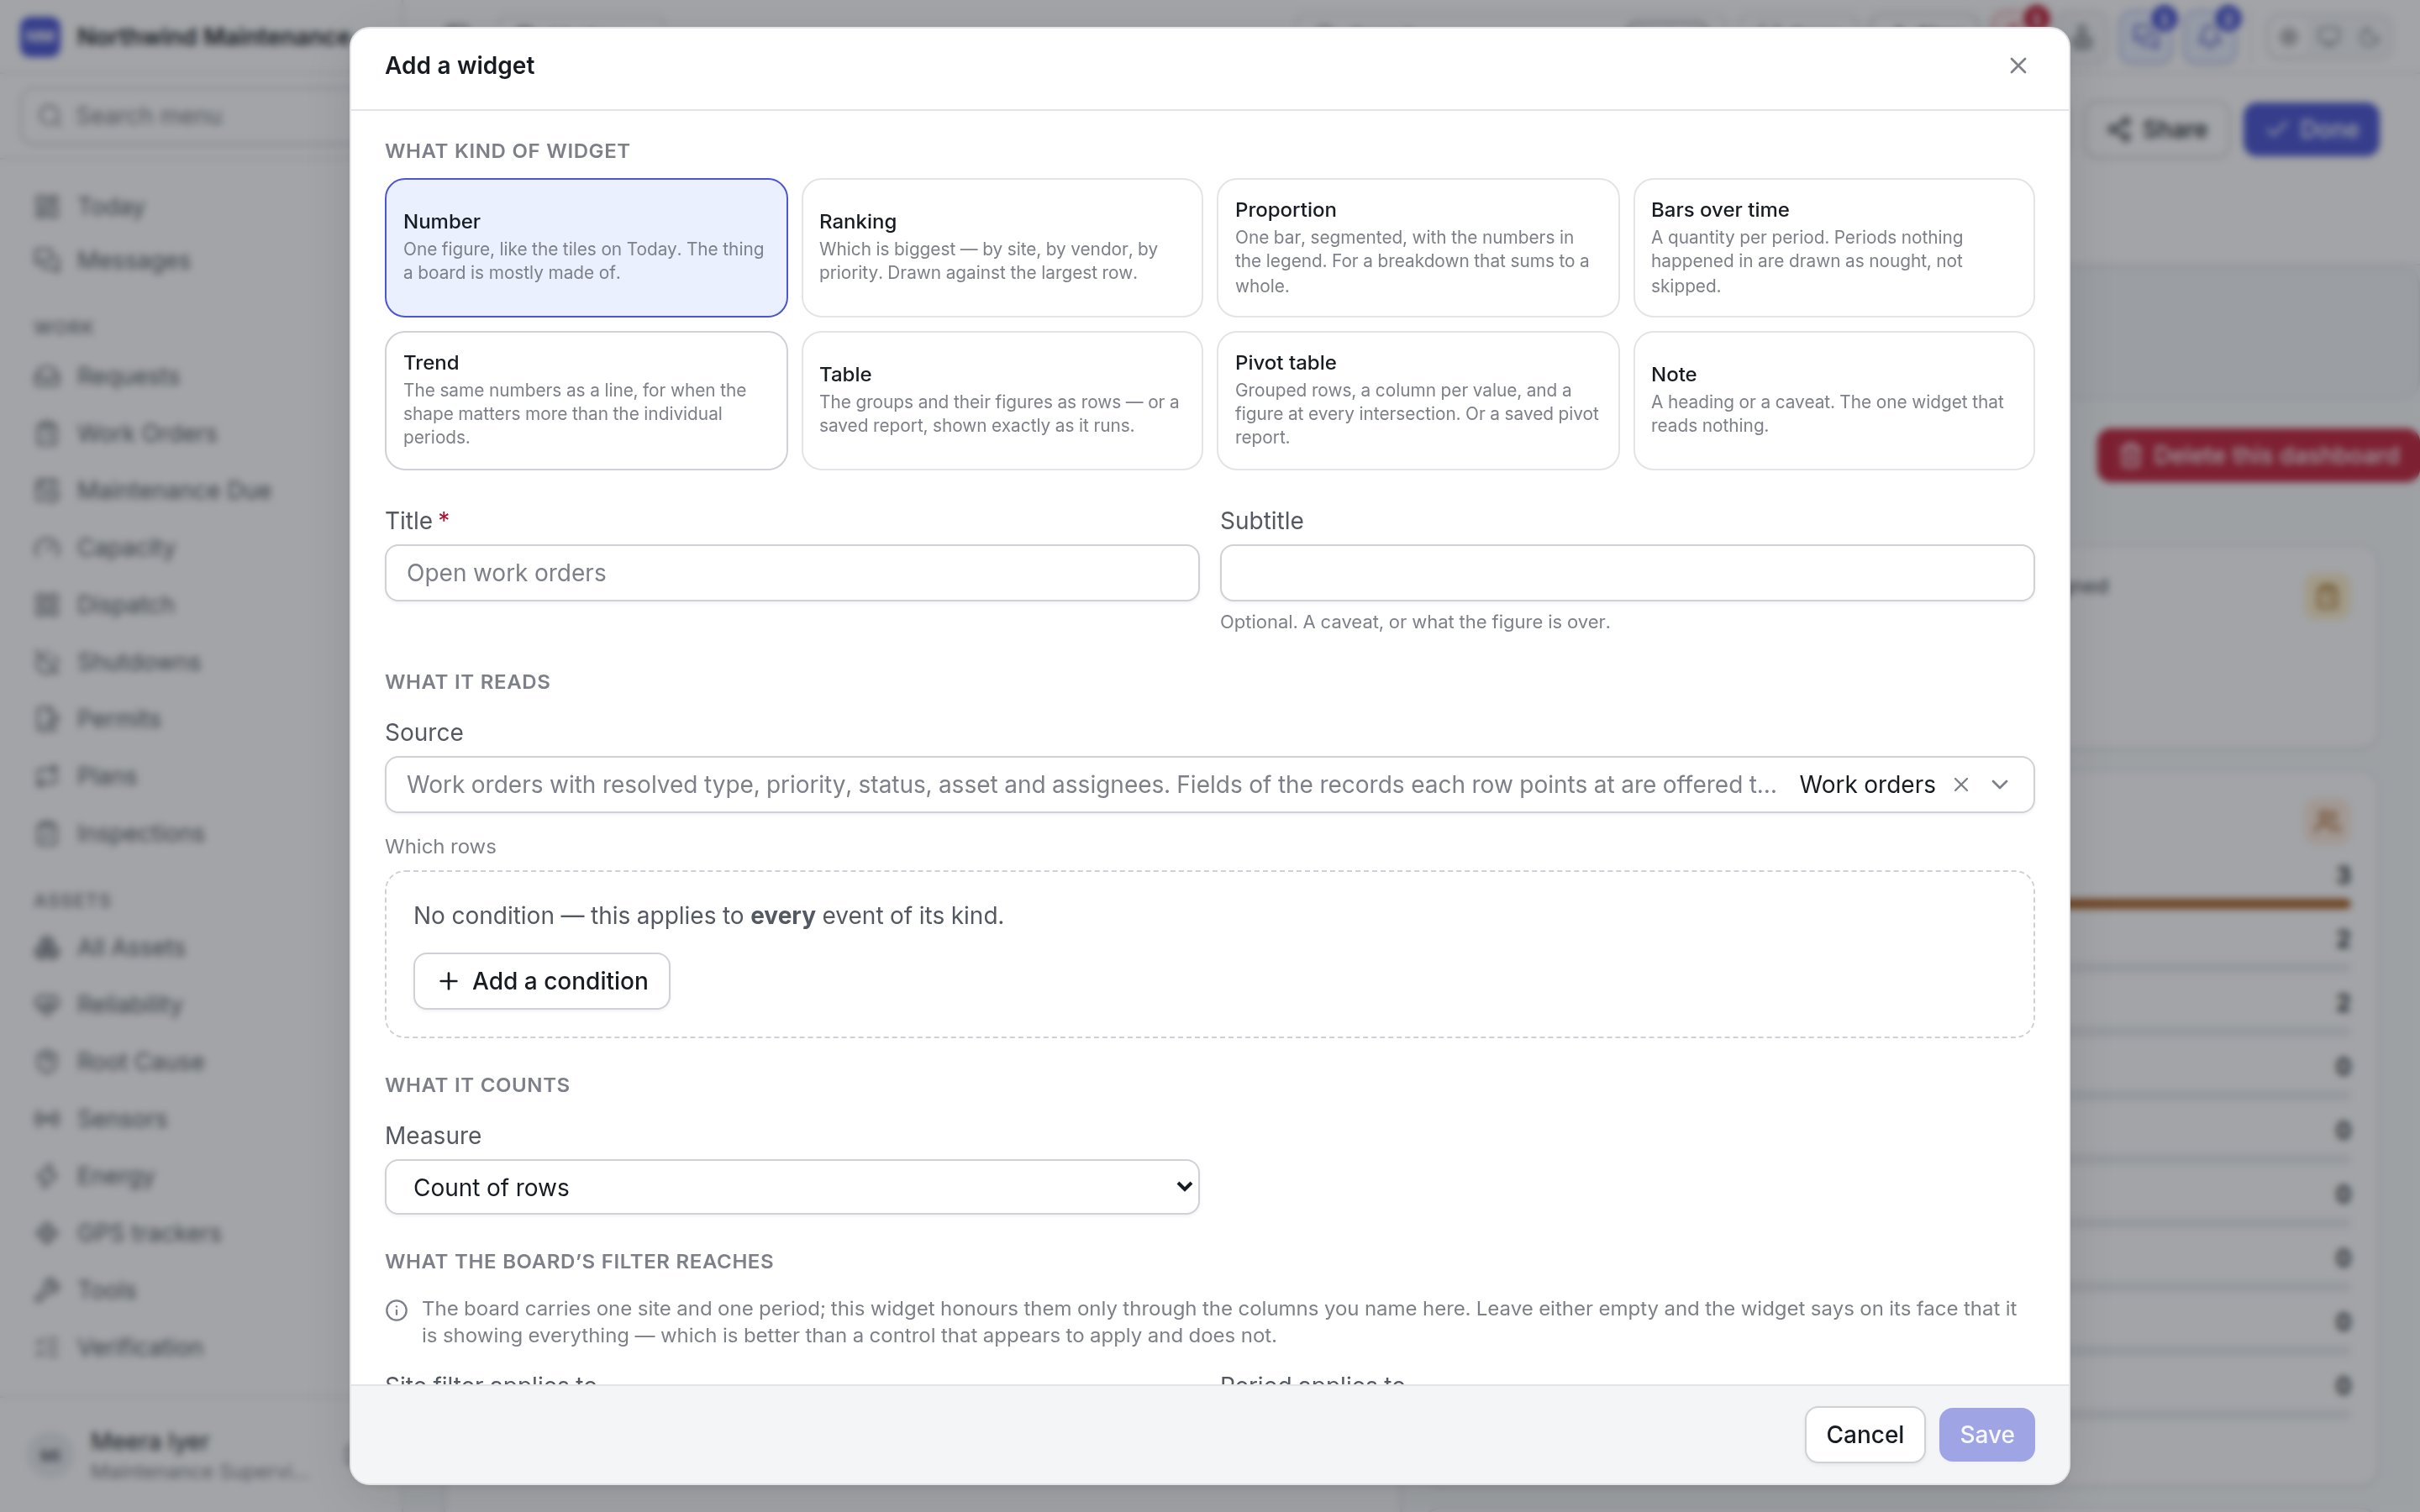
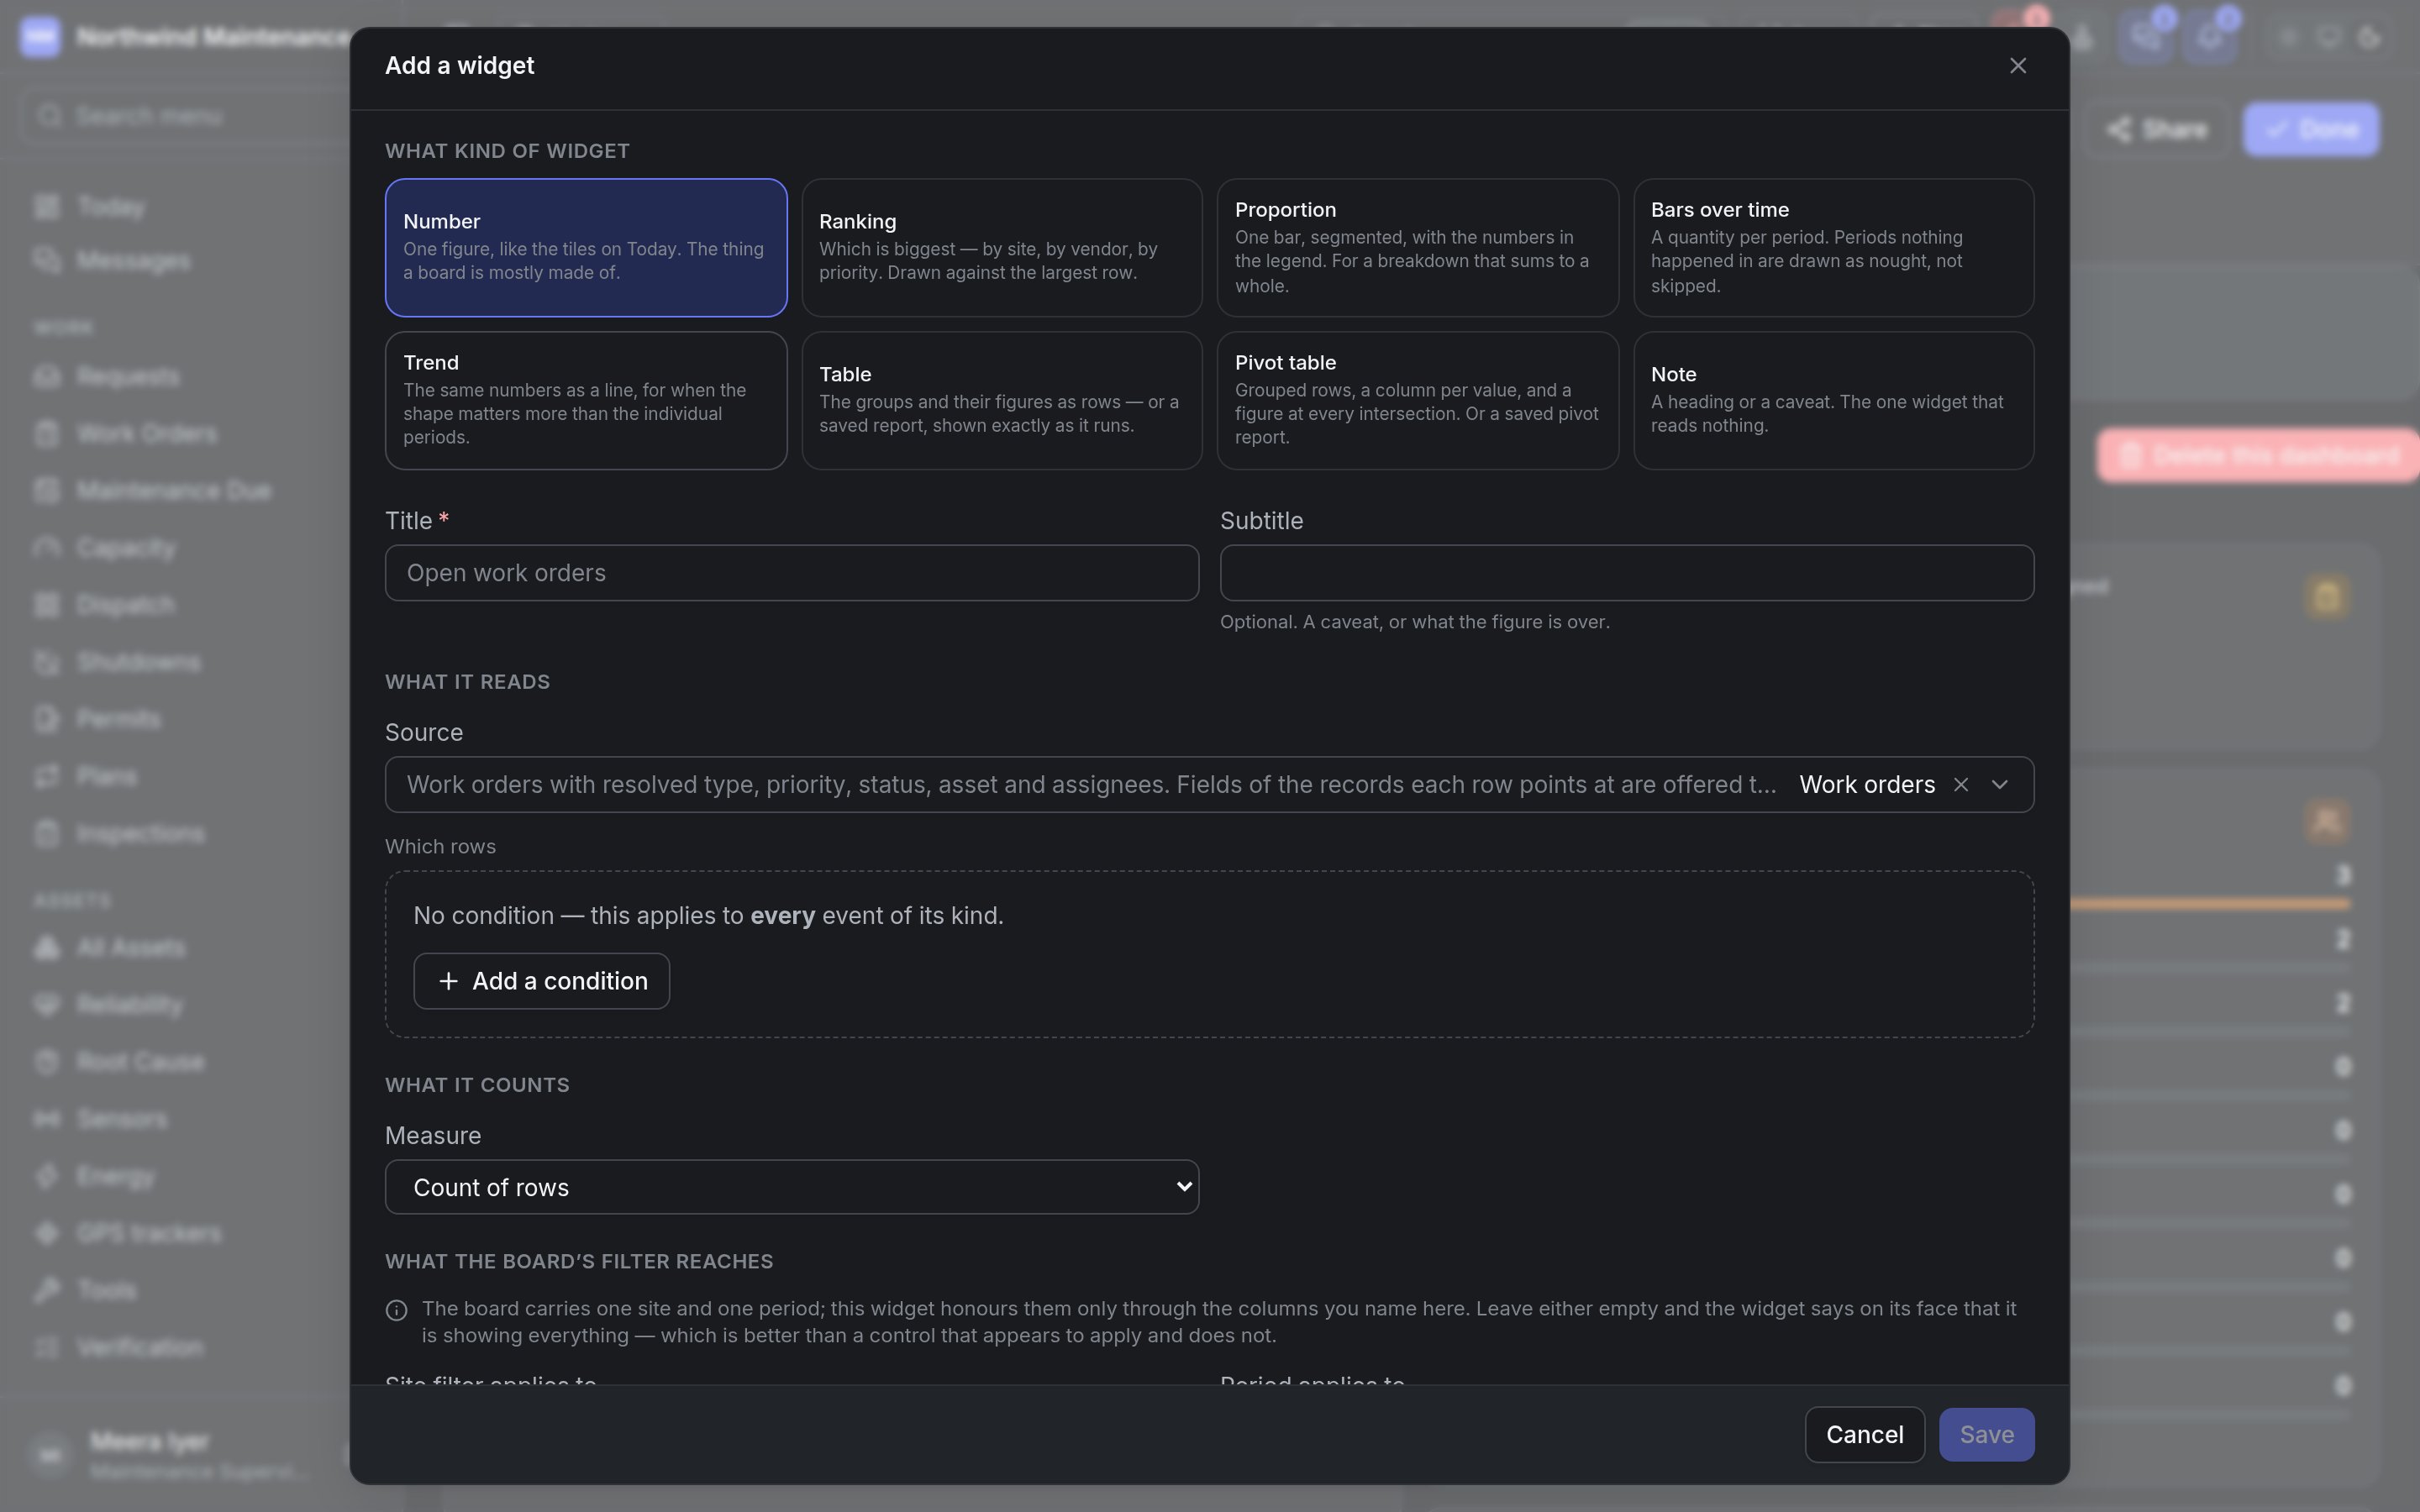
**Add a widget**, or clicking a widget in Arrange mode, opens the editor. It asks its questions in
the order you answer them: what kind of widget, what it reads, what it counts, what the board's
filter reaches and how it reads. Sections that do not apply to the kind you chose are not shown.
| Toolbar button | What it does |
| - | - |
| **Add a widget** | Opens the widget editor, below |
| **Publish** / **Move back to draft** | A published board can be sent on a schedule; a draft cannot. Publishing does not change who can see the board — sharing does that |
| **Send it on a schedule** | Opens [Send this dashboard](#sending-a-board-on-a-schedule). Needs permission to share dashboards |
| **Delete this dashboard** | Deletes the board, its widgets and its schedules, and returns you to the list |
**Delete this dashboard** and a widget's **Remove widget** act at once — there is no confirmation
step. If you only want to stop a board being sent, edit its schedule instead.
### The controls on each widget
A board is a reading order and a width, not a free canvas. Widgets fill a twelve-column grid from
left to right and wrap, so the same board reads correctly on a laptop, on a phone and on a printed
page. Nothing can overlap and no gap is left behind when you remove a widget.
| Control | What it does |
| - | - |
| Grip | Drag the widget to a new place in the order |
| **Move earlier** / **Move later** | The same as dragging, one place at a time — for a keyboard or a touch screen |
| **Narrower** / **Wider** | Steps the width through a quarter, a third, a half, two thirds and the full width of the board |
| **Taller** (shows 1×, 2× or 3×) | Cycles the widget through one, two and three rows high |
| **Remove widget** | Deletes the widget straight away |
| Click anywhere on the widget | Opens it in the widget editor |
On a narrow screen a widget may be drawn wider than you arranged it, so its figure stays readable.
It is never drawn narrower.
Press **Done** to leave Arrange mode. Every change is saved as you make it.
## Building a widget
**Add a widget**, or clicking a widget in Arrange mode, opens the editor. It asks its questions in
the order you answer them: what kind of widget, what it reads, what it counts, what the board's
filter reaches and how it reads. Sections that do not apply to the kind you chose are not shown.
 ### What kind of widget
| Kind | What it is for | Needs | Default size |
| - | - | - | - |
| **Number** | One figure, like the tiles on Today. Most of a board is made of these | A measure | A quarter wide, one row |
| **Ranking** | Which is biggest — by site, by vendor, by priority — drawn as bars against the largest row | A measure and a column to break it down by. Can be split by a second column | Half wide, two rows |
| **Proportion** | One segmented bar with the numbers in the legend, for a breakdown that adds up to a whole | A measure and a column to break it down by | Half wide, one row |
| **Bars over time** | A quantity per period. Periods in which nothing happened are drawn as nought, not skipped | A measure, a date column and a period size. Can be split by a second column | Half wide, two rows |
| **Trend** | The same figures as a line, for when the shape matters more than any one period | A measure, a date column and a period size | Half wide, two rows |
| **Table** | The groups and their figures as rows — or a saved report, shown exactly as it runs | A measure and a column to group by, or a saved report | Half wide, two rows |
| **Pivot table** | Grouped rows, a column per value, and a figure at every intersection — or a saved pivot report. Can also be drawn as a chart | At least one figure, or a saved report | Half wide, three rows |
| **Note** | A heading or a caveat. The only widget that reads nothing | Its text | Full width, one row |
Changing the kind keeps everything that still applies and clears anything the new kind cannot use —
a Number has no breakdown, and only Bars over time and Trend have a period size.
### The fields
**Save** stays unavailable until the widget has everything its kind needs.
| Field | What it means | Notes |
| - | - | - |
| **Title** | The question the figure answers, shown at the top of the widget | Required. Wraps to two lines on the tile |
| **Subtitle** | A caveat, or what the figure is over ("work finished in the period") | Optional |
| **What it says** | The text of a **Note** | Required for a Note, and the only other field a Note has |
| **From a saved report** | Shows a report you composed in [Reports](/analytics/reports), exactly as it runs | **Table** and **Pivot table** only. **Build it from a source** (the default) leaves it off. Choosing a report hides the source, filter and measure fields, because the report already answers them |
| **Source** | The list of records the widget reads — work orders, assets, parts, purchase orders and so on | Defaults to **Work orders**. The options and their descriptions are the same sources the report builder uses. Changing the source clears the filter, measure column, breakdown and both bindings, because column names belong to the source they came from |
| **Which rows** | Conditions that narrow the source — "priority is High", "status category is not Closed" | Optional. **Add a condition** builds a clause from a column, a test and a value; clauses can be grouped and combined with **All of these must hold** or **Any one of these is enough**. Empty means every row the reader may see |
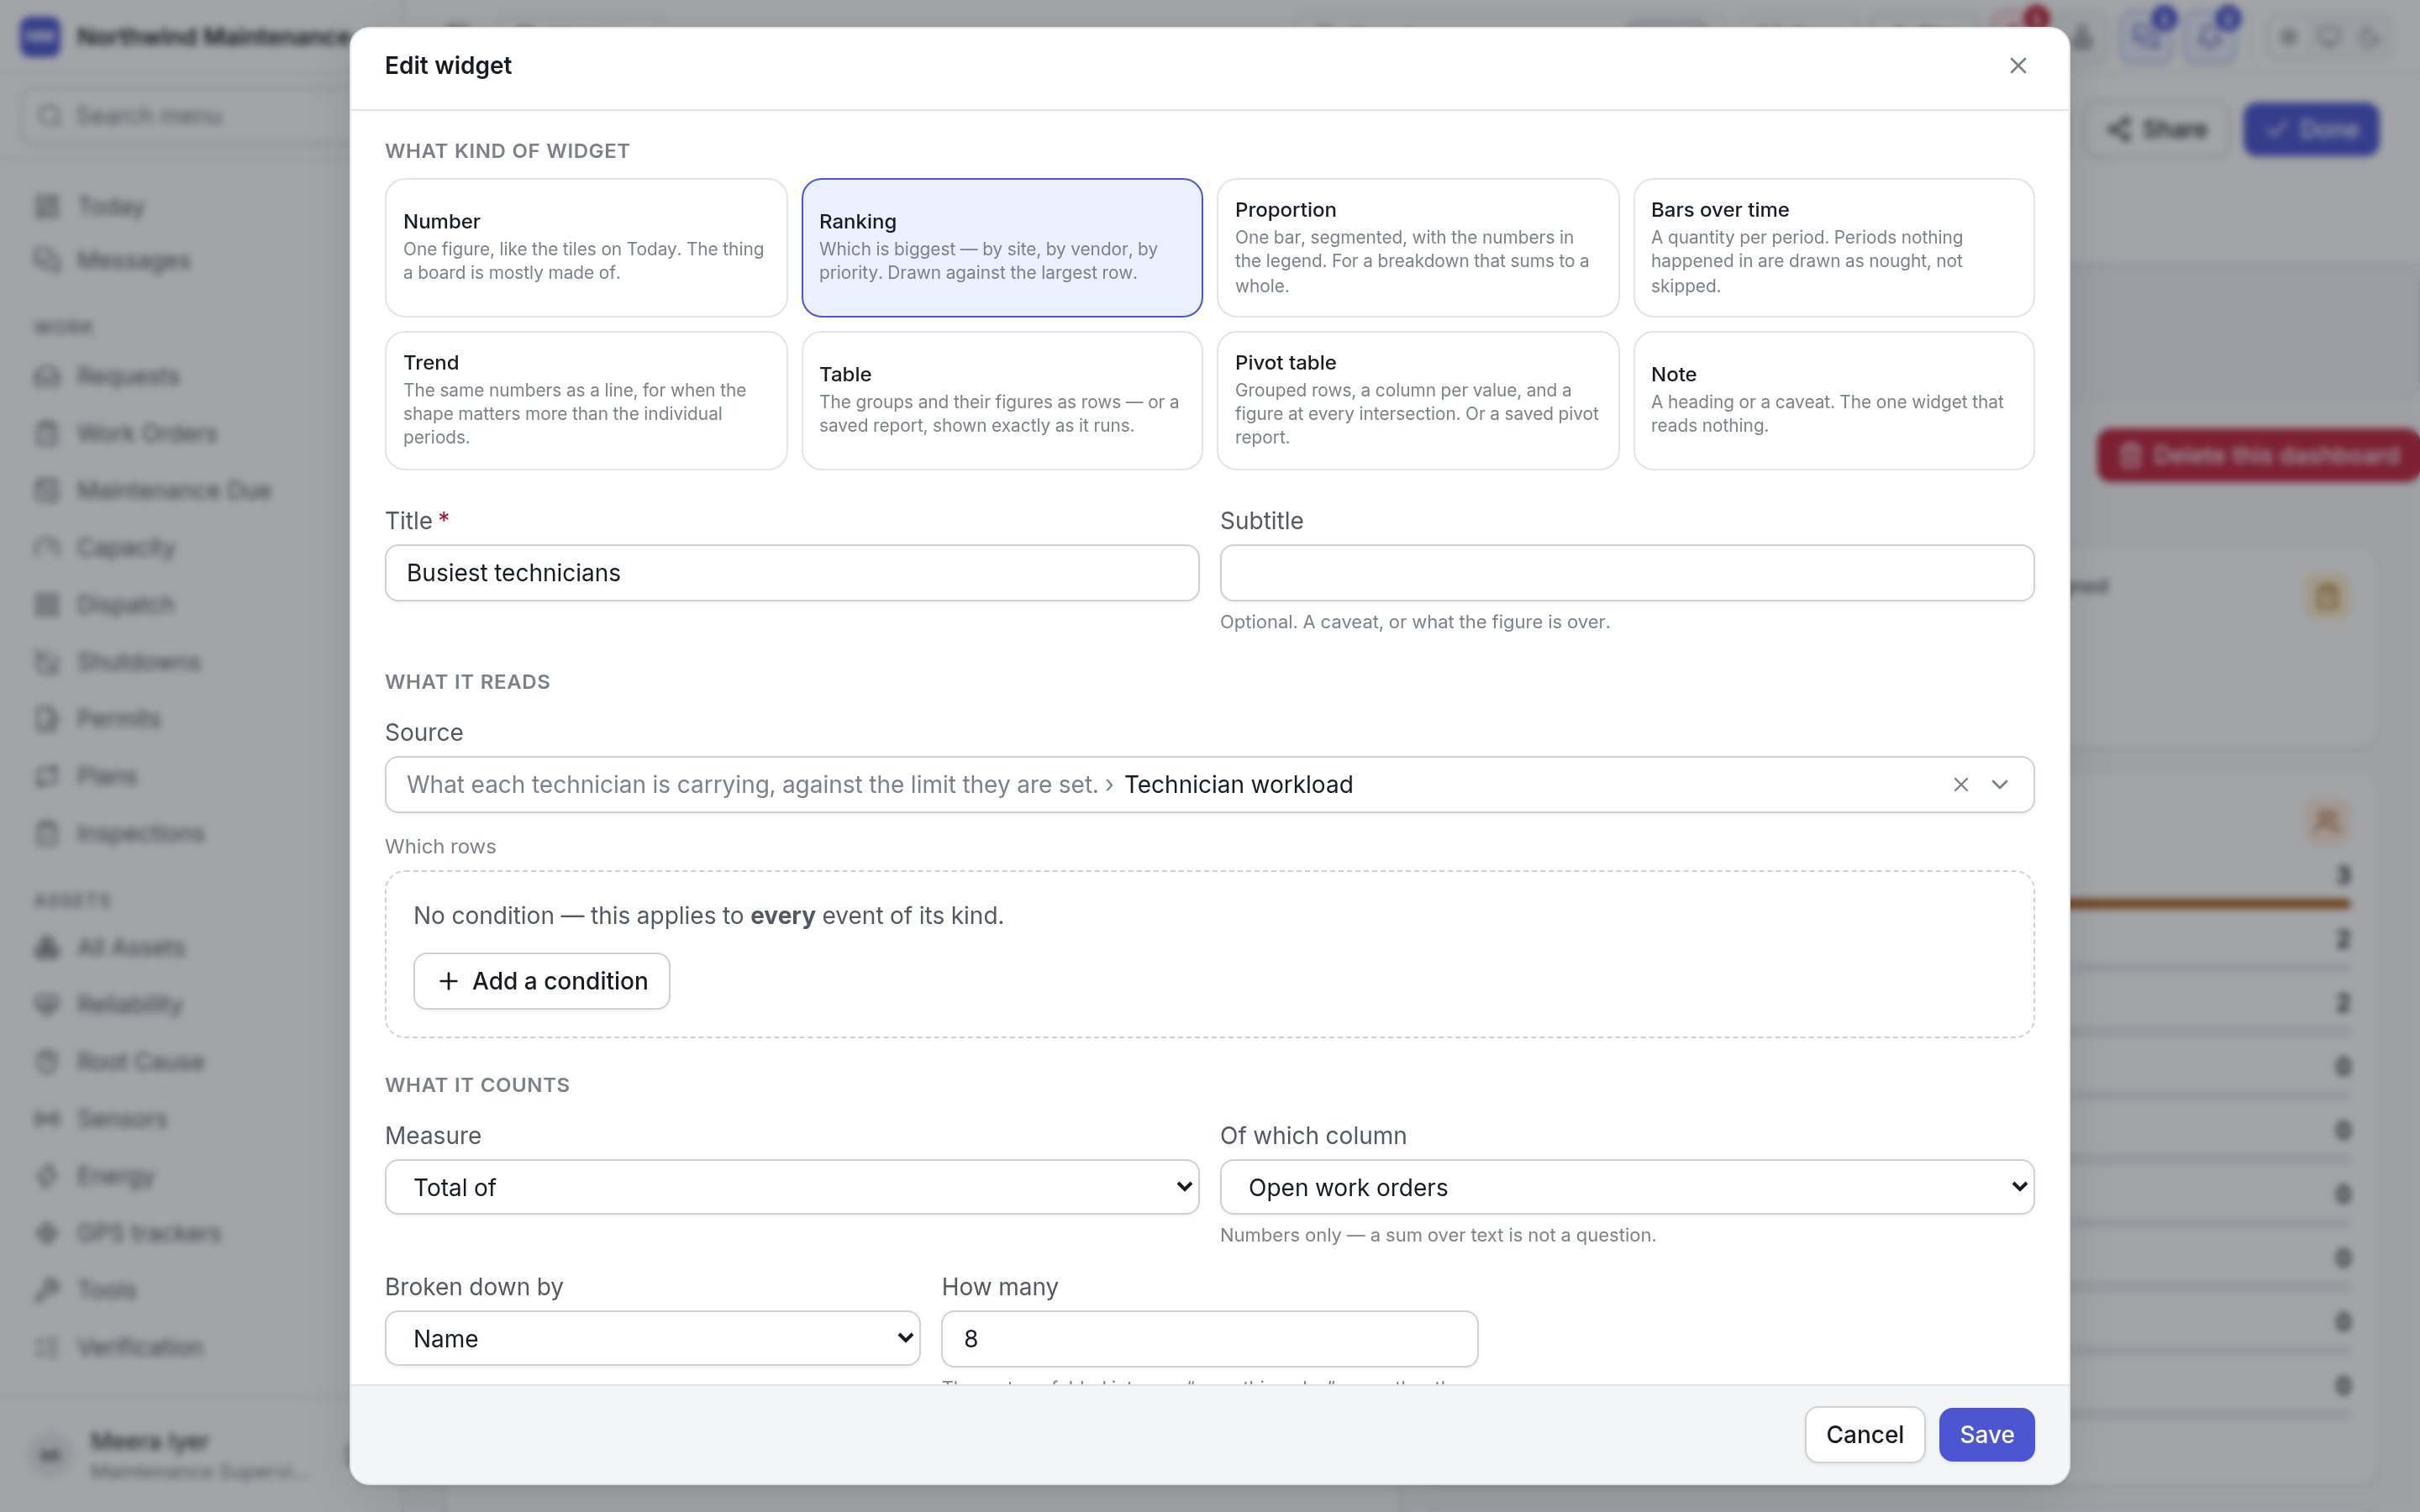
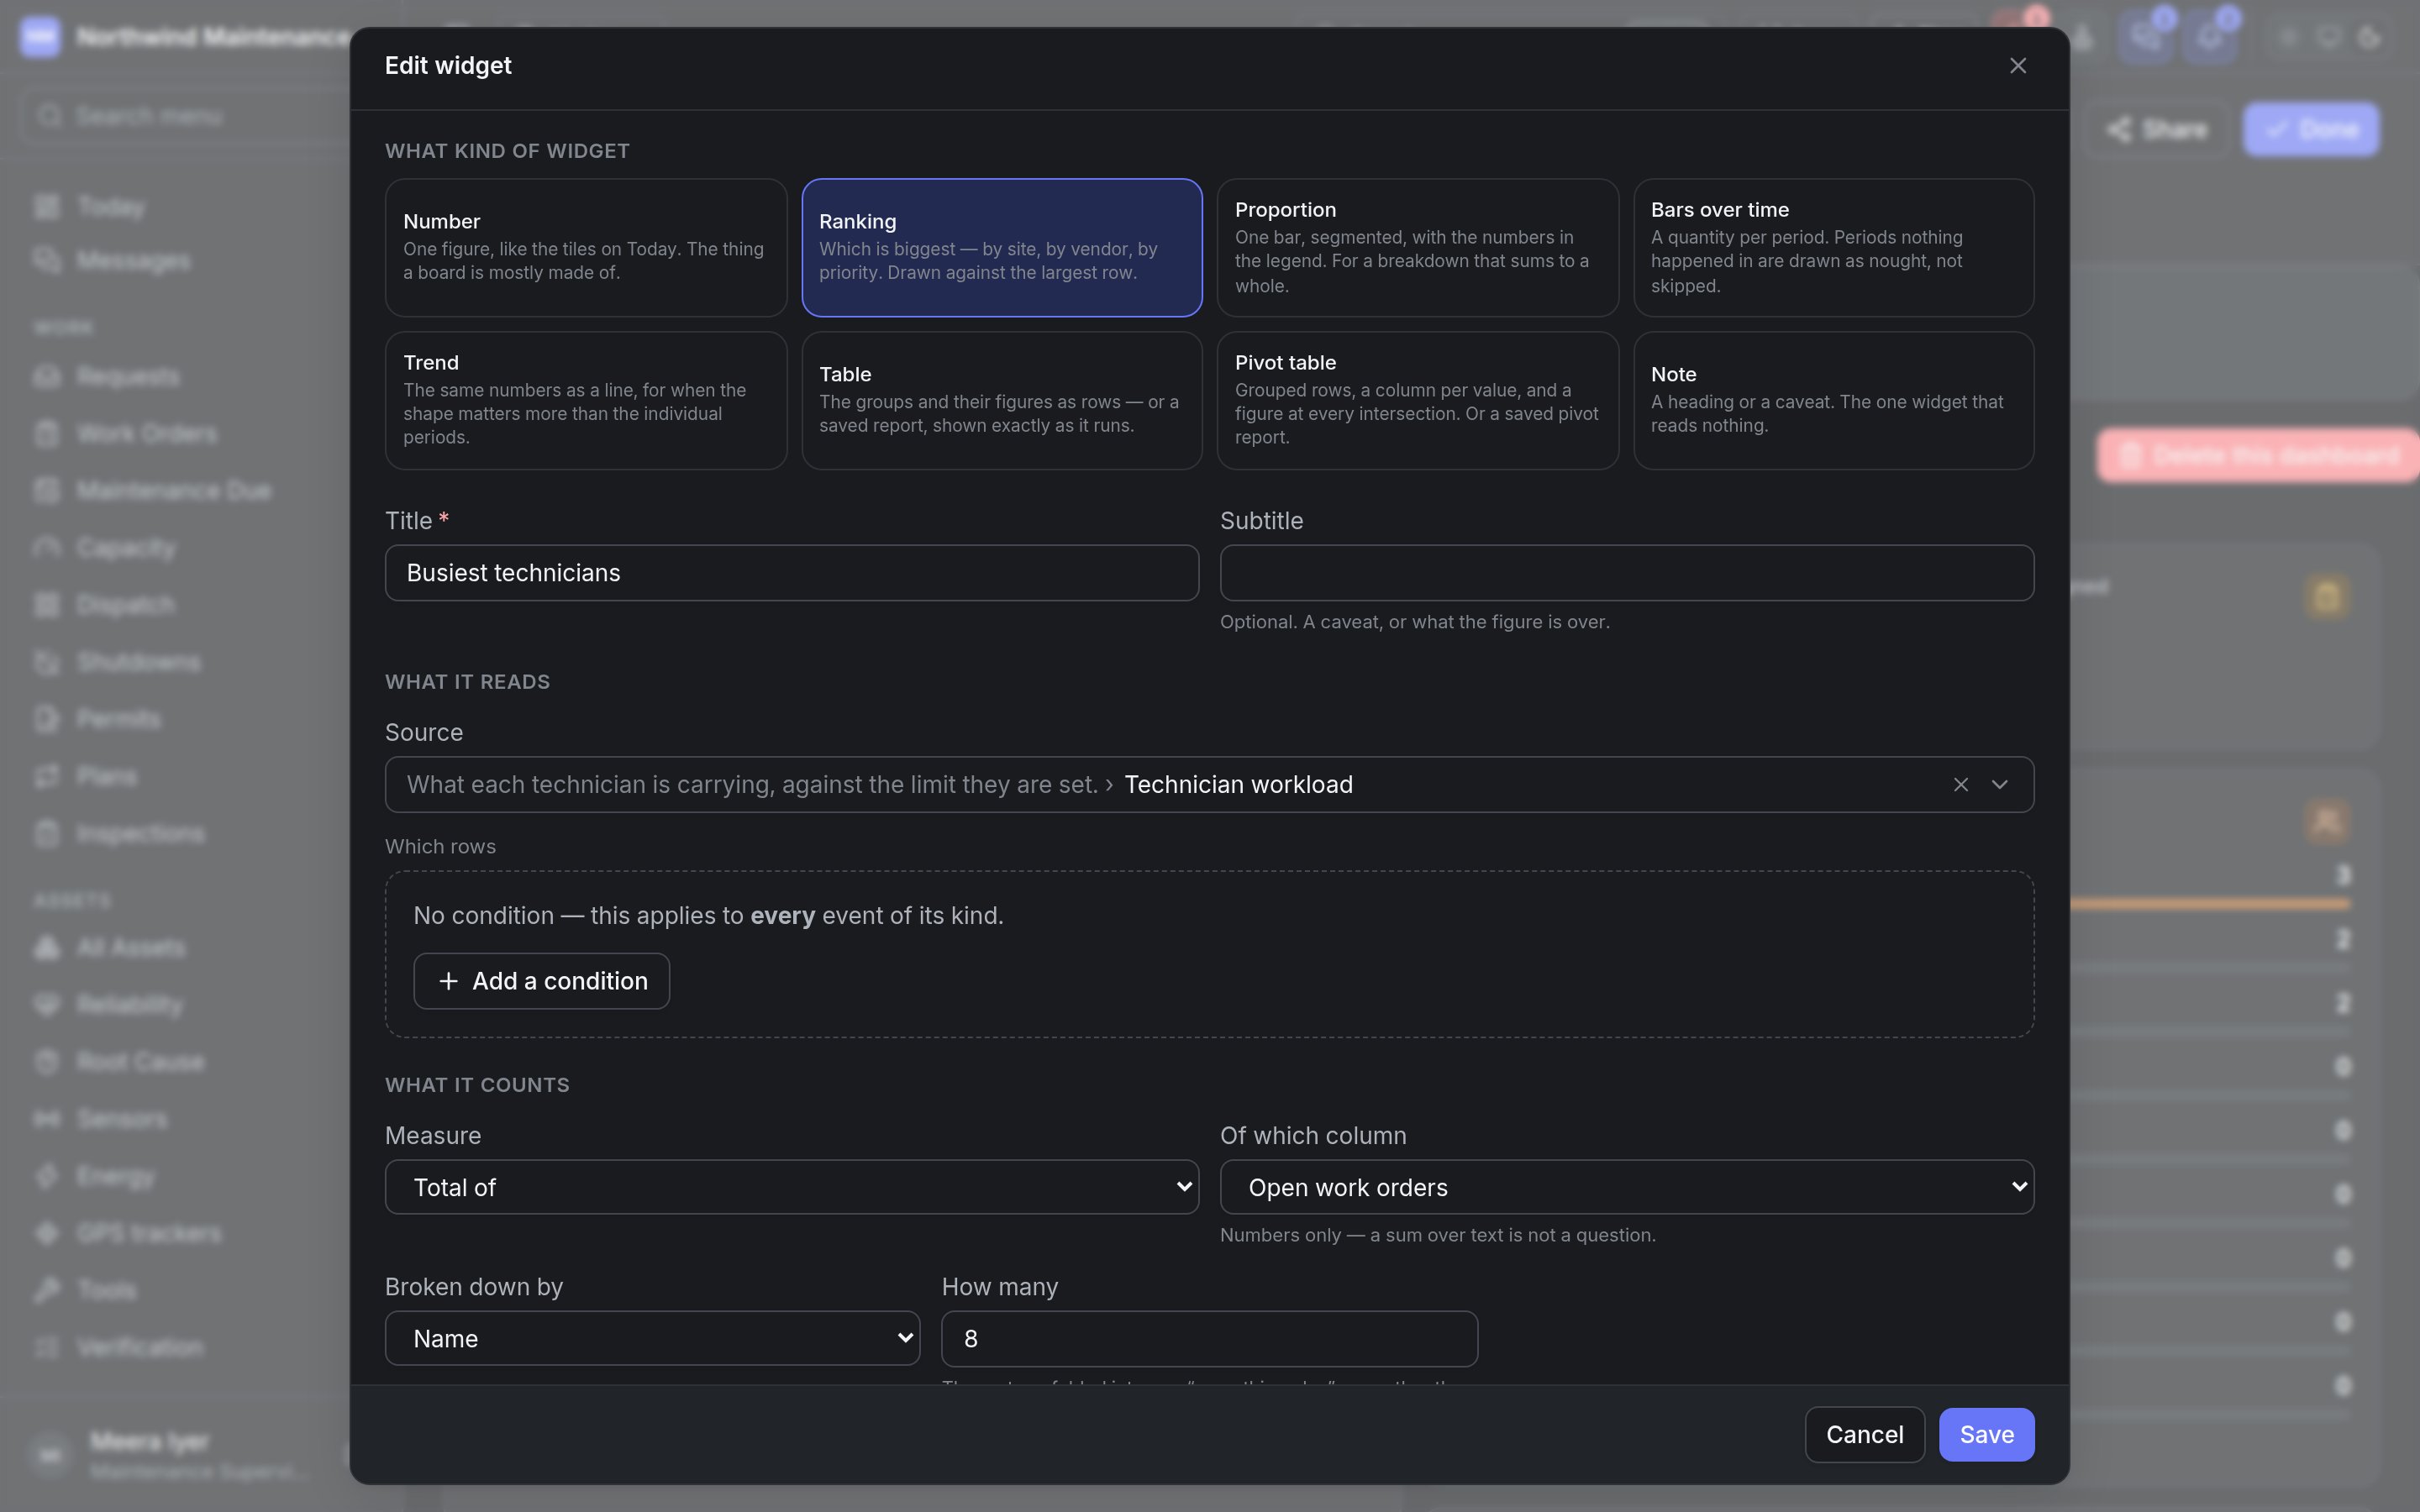
| **Measure** | What is counted: **Count of rows**, **Total of**, **Average of**, **Smallest** or **Largest** | Defaults to **Count of rows** |
| **Of which column** | The column a total, an average, a smallest or a largest is taken over | Appears for every measure except a count. **Total of** and **Average of** offer numeric columns only |
| **Broken down by** | The column whose values become the bars, segments or rows | Required for every kind except Number, Pivot table and Note. For **Bars over time** and **Trend** only date columns are offered |
| **Per** | The size of each period: **By day**, **By week**, **By month**, **By quarter**, **By year** | **Bars over time** and **Trend** only. Defaults to **By month** |
| **How many** | How many bars or rows to draw | 1 to 50, default 10. The rest are folded into one **Everything else** row rather than dropped, so the total is still the whole answer |
| **And split each by** | A second column drawn as segments of each bar — open and closed, per team | **Ranking** and **Bars over time** only, once a breakdown is chosen. Optional; **Not split** by default. Dates and the breakdown column itself are not offered |
| **Drawn as** | **Stacked** shows what each total is made of; **Side by side** compares the parts | Appears once a split is chosen. Defaults to **Stacked** |
| **How many segments** | How many split values get their own colour | 1 to 12, default 5. The rest are folded into one |
| **Order** | **Biggest first**, **Smallest first** or **By name** | **Ranking**, **Proportion** and **Table**. Periods are always drawn oldest first |
The column lists can be long, because a source offers both its own columns and the columns of the
records each row points at — a work order's asset, site, team and so on. The record's own columns come
first; borrowed ones are grouped under the record they came from.
### A pivot table widget
Choosing **Pivot table** replaces the measure fields with the same builder the report builder uses
for **Counts and totals**:
| Part | What it means | Notes |
| - | - | - |
| **Figures** | One column per figure, at every intersection of the groups. Each figure is **How many**, **Total of**, **Average of**, **Smallest** or **Largest**, optionally over a column, with a heading of your own in **What to call it** | At least one is required; up to eight. **Another figure** adds one |
| **Rows** | The groups, nested in the order you add them — site, then asset type. A date column can be grouped by day, week, month, quarter or year | Up to four levels. With none, the answer is one row over everything the filter matched |
| **Columns** | One column's values spread across the top — a column per month, or per status — with **at most** a number of columns | Optional. Values past the limit are counted in the total column rather than dropped. A tile is narrow, so keep the limit small |
| **A subtotal under each group** | Adds a subtotal row for each outer group | Needs two levels of rows |
| **A grand total** | Adds a total row at the foot | On by default |
| **Draw it as** | **A table** (the default), **A line**, **Columns**, **Bars** or **A pie** | A pivot drawn as a line is the only way to show a rate, such as a percentage, as a trend on a board |
### What the board's filter reaches
| Field | What it means | Notes |
| - | - | - |
| **Site filter applies to** | Which column of the source the board's **Site** selection is matched against | Offers the source's identifier columns. Suggested automatically when the source has a site column; **Not filtered by site** turns it off. A suggestion you clear stays cleared |
| **Period applies to** | Which date column the board's **Period** is matched against | Offers the source's date columns. **Not filtered by period** by default. The period is a look-back window, so a widget about what is coming — work due next week — should leave this empty and say so in its own filter |
Leave either empty and the widget says on its face that it is counting everything, which is better
than a control that appears to apply and does not.
### How it reads
| Field | What it means | Notes |
| - | - | - |
| **Unit** | How the figure is written: **Plain number**, **Money**, **Percentage**, **Hours** or **Days** | Defaults to **Plain number** |
| **Good when** | Whether a higher or a lower figure is better | **Neither** by default. "Leave it neutral unless the number is a verdict. A count of work orders is a workload." Only a verdict is coloured |
| **Amber past** | The threshold beyond which the figure turns amber | Optional. "Beyond" means above when higher is worse, and below when higher is better |
| **Red past** | The threshold beyond which the figure turns red | Optional |
| **Target** | A figure to aim for | Optional. Drawn as a reference line on a chart and named under a tile, always inside the scale |
### What kind of widget
| Kind | What it is for | Needs | Default size |
| - | - | - | - |
| **Number** | One figure, like the tiles on Today. Most of a board is made of these | A measure | A quarter wide, one row |
| **Ranking** | Which is biggest — by site, by vendor, by priority — drawn as bars against the largest row | A measure and a column to break it down by. Can be split by a second column | Half wide, two rows |
| **Proportion** | One segmented bar with the numbers in the legend, for a breakdown that adds up to a whole | A measure and a column to break it down by | Half wide, one row |
| **Bars over time** | A quantity per period. Periods in which nothing happened are drawn as nought, not skipped | A measure, a date column and a period size. Can be split by a second column | Half wide, two rows |
| **Trend** | The same figures as a line, for when the shape matters more than any one period | A measure, a date column and a period size | Half wide, two rows |
| **Table** | The groups and their figures as rows — or a saved report, shown exactly as it runs | A measure and a column to group by, or a saved report | Half wide, two rows |
| **Pivot table** | Grouped rows, a column per value, and a figure at every intersection — or a saved pivot report. Can also be drawn as a chart | At least one figure, or a saved report | Half wide, three rows |
| **Note** | A heading or a caveat. The only widget that reads nothing | Its text | Full width, one row |
Changing the kind keeps everything that still applies and clears anything the new kind cannot use —
a Number has no breakdown, and only Bars over time and Trend have a period size.
### The fields
**Save** stays unavailable until the widget has everything its kind needs.
| Field | What it means | Notes |
| - | - | - |
| **Title** | The question the figure answers, shown at the top of the widget | Required. Wraps to two lines on the tile |
| **Subtitle** | A caveat, or what the figure is over ("work finished in the period") | Optional |
| **What it says** | The text of a **Note** | Required for a Note, and the only other field a Note has |
| **From a saved report** | Shows a report you composed in [Reports](/analytics/reports), exactly as it runs | **Table** and **Pivot table** only. **Build it from a source** (the default) leaves it off. Choosing a report hides the source, filter and measure fields, because the report already answers them |
| **Source** | The list of records the widget reads — work orders, assets, parts, purchase orders and so on | Defaults to **Work orders**. The options and their descriptions are the same sources the report builder uses. Changing the source clears the filter, measure column, breakdown and both bindings, because column names belong to the source they came from |
| **Which rows** | Conditions that narrow the source — "priority is High", "status category is not Closed" | Optional. **Add a condition** builds a clause from a column, a test and a value; clauses can be grouped and combined with **All of these must hold** or **Any one of these is enough**. Empty means every row the reader may see |
| **Measure** | What is counted: **Count of rows**, **Total of**, **Average of**, **Smallest** or **Largest** | Defaults to **Count of rows** |
| **Of which column** | The column a total, an average, a smallest or a largest is taken over | Appears for every measure except a count. **Total of** and **Average of** offer numeric columns only |
| **Broken down by** | The column whose values become the bars, segments or rows | Required for every kind except Number, Pivot table and Note. For **Bars over time** and **Trend** only date columns are offered |
| **Per** | The size of each period: **By day**, **By week**, **By month**, **By quarter**, **By year** | **Bars over time** and **Trend** only. Defaults to **By month** |
| **How many** | How many bars or rows to draw | 1 to 50, default 10. The rest are folded into one **Everything else** row rather than dropped, so the total is still the whole answer |
| **And split each by** | A second column drawn as segments of each bar — open and closed, per team | **Ranking** and **Bars over time** only, once a breakdown is chosen. Optional; **Not split** by default. Dates and the breakdown column itself are not offered |
| **Drawn as** | **Stacked** shows what each total is made of; **Side by side** compares the parts | Appears once a split is chosen. Defaults to **Stacked** |
| **How many segments** | How many split values get their own colour | 1 to 12, default 5. The rest are folded into one |
| **Order** | **Biggest first**, **Smallest first** or **By name** | **Ranking**, **Proportion** and **Table**. Periods are always drawn oldest first |
The column lists can be long, because a source offers both its own columns and the columns of the
records each row points at — a work order's asset, site, team and so on. The record's own columns come
first; borrowed ones are grouped under the record they came from.
### A pivot table widget
Choosing **Pivot table** replaces the measure fields with the same builder the report builder uses
for **Counts and totals**:
| Part | What it means | Notes |
| - | - | - |
| **Figures** | One column per figure, at every intersection of the groups. Each figure is **How many**, **Total of**, **Average of**, **Smallest** or **Largest**, optionally over a column, with a heading of your own in **What to call it** | At least one is required; up to eight. **Another figure** adds one |
| **Rows** | The groups, nested in the order you add them — site, then asset type. A date column can be grouped by day, week, month, quarter or year | Up to four levels. With none, the answer is one row over everything the filter matched |
| **Columns** | One column's values spread across the top — a column per month, or per status — with **at most** a number of columns | Optional. Values past the limit are counted in the total column rather than dropped. A tile is narrow, so keep the limit small |
| **A subtotal under each group** | Adds a subtotal row for each outer group | Needs two levels of rows |
| **A grand total** | Adds a total row at the foot | On by default |
| **Draw it as** | **A table** (the default), **A line**, **Columns**, **Bars** or **A pie** | A pivot drawn as a line is the only way to show a rate, such as a percentage, as a trend on a board |
### What the board's filter reaches
| Field | What it means | Notes |
| - | - | - |
| **Site filter applies to** | Which column of the source the board's **Site** selection is matched against | Offers the source's identifier columns. Suggested automatically when the source has a site column; **Not filtered by site** turns it off. A suggestion you clear stays cleared |
| **Period applies to** | Which date column the board's **Period** is matched against | Offers the source's date columns. **Not filtered by period** by default. The period is a look-back window, so a widget about what is coming — work due next week — should leave this empty and say so in its own filter |
Leave either empty and the widget says on its face that it is counting everything, which is better
than a control that appears to apply and does not.
### How it reads
| Field | What it means | Notes |
| - | - | - |
| **Unit** | How the figure is written: **Plain number**, **Money**, **Percentage**, **Hours** or **Days** | Defaults to **Plain number** |
| **Good when** | Whether a higher or a lower figure is better | **Neither** by default. "Leave it neutral unless the number is a verdict. A count of work orders is a workload." Only a verdict is coloured |
| **Amber past** | The threshold beyond which the figure turns amber | Optional. "Beyond" means above when higher is worse, and below when higher is better |
| **Red past** | The threshold beyond which the figure turns red | Optional |
| **Target** | A figure to aim for | Optional. Drawn as a reference line on a chart and named under a tile, always inside the scale |
 When you save, the server checks the widget against the source it reads. A column that does not
exist, a total over a text column or a period bound to something that is not a date is refused, and
the reason appears at the top of the editor.
### Keeping a Copilot chart on a board
Where your organisation uses [Copilot](/analytics/copilot), a question answered with a chart offers
**Keep this** beside a **Choose a board…** list of your own boards. The chart is added to the board
as an ordinary widget, which you can then move, resize and edit like any other. It needs permission
to create dashboards.
## Sharing a board
**Share**, on a board you own, opens **Who is this dashboard for?** The dialog repeats the warning
from the list: sharing decides whose list the board appears in, never what it may show, and the board
stays read-only for everybody but you.
When you save, the server checks the widget against the source it reads. A column that does not
exist, a total over a text column or a period bound to something that is not a date is refused, and
the reason appears at the top of the editor.
### Keeping a Copilot chart on a board
Where your organisation uses [Copilot](/analytics/copilot), a question answered with a chart offers
**Keep this** beside a **Choose a board…** list of your own boards. The chart is added to the board
as an ordinary widget, which you can then move, resize and edit like any other. It needs permission
to create dashboards.
## Sharing a board
**Share**, on a board you own, opens **Who is this dashboard for?** The dialog repeats the warning
from the list: sharing decides whose list the board appears in, never what it may show, and the board
stays read-only for everybody but you.
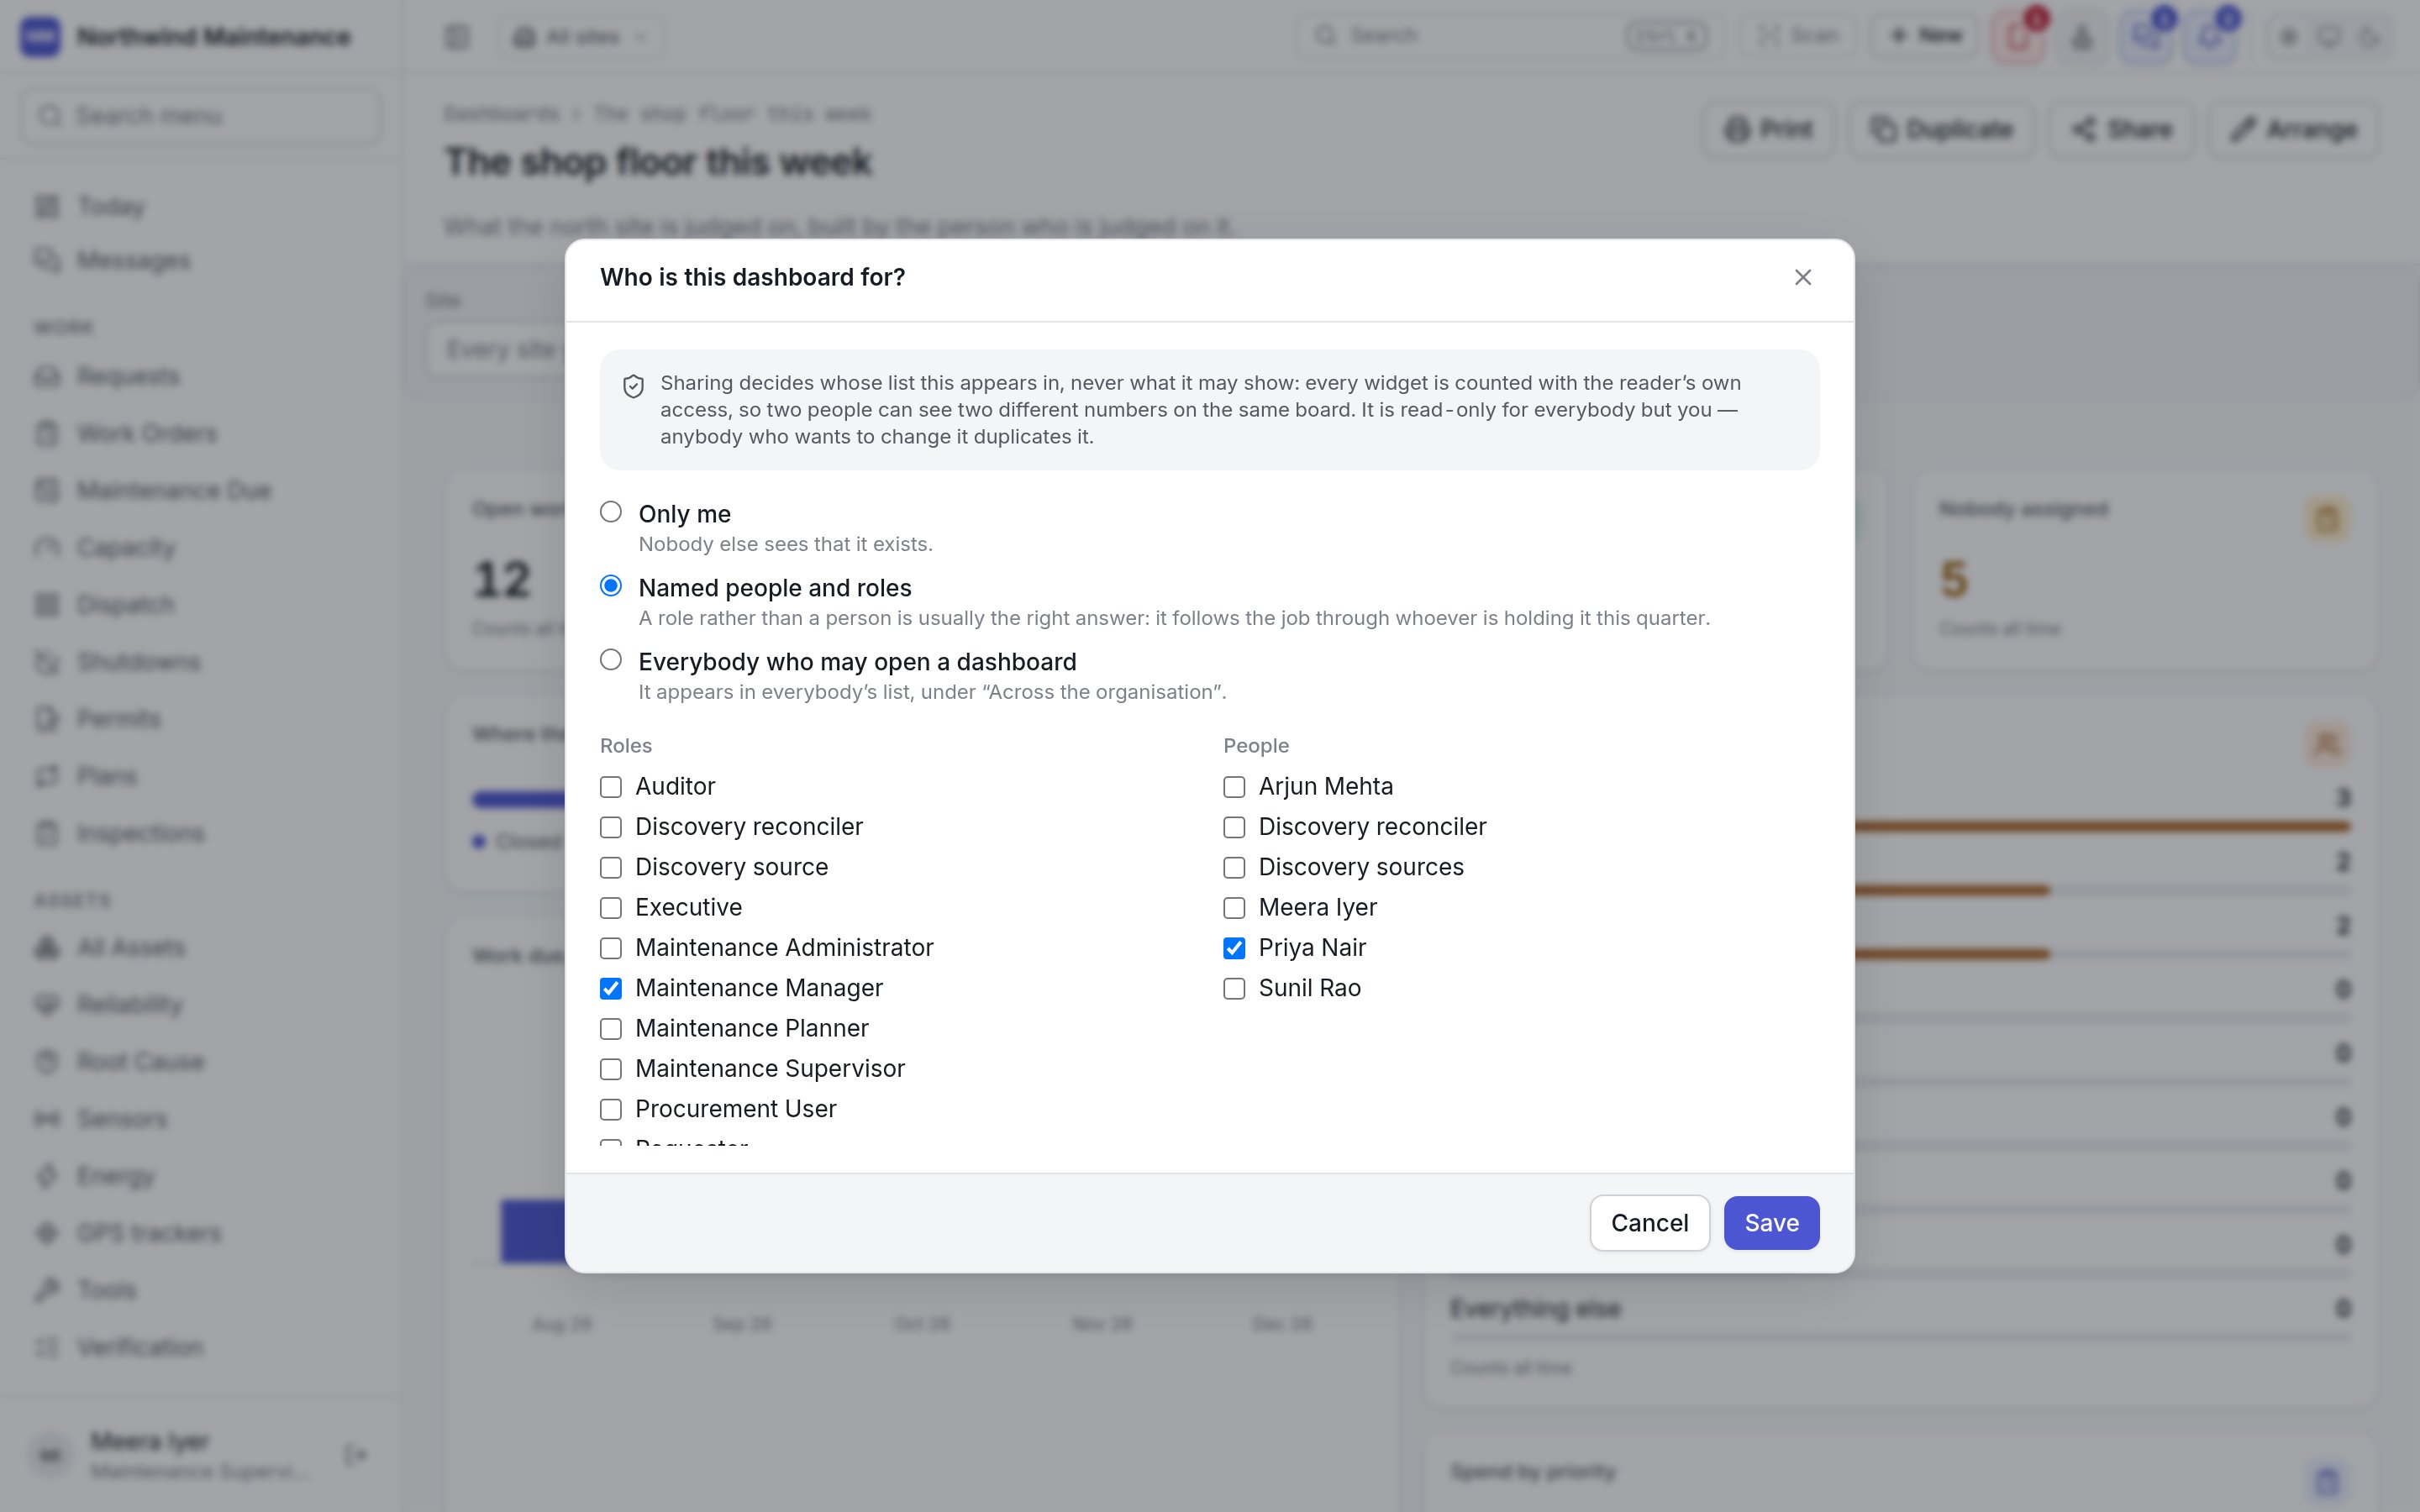
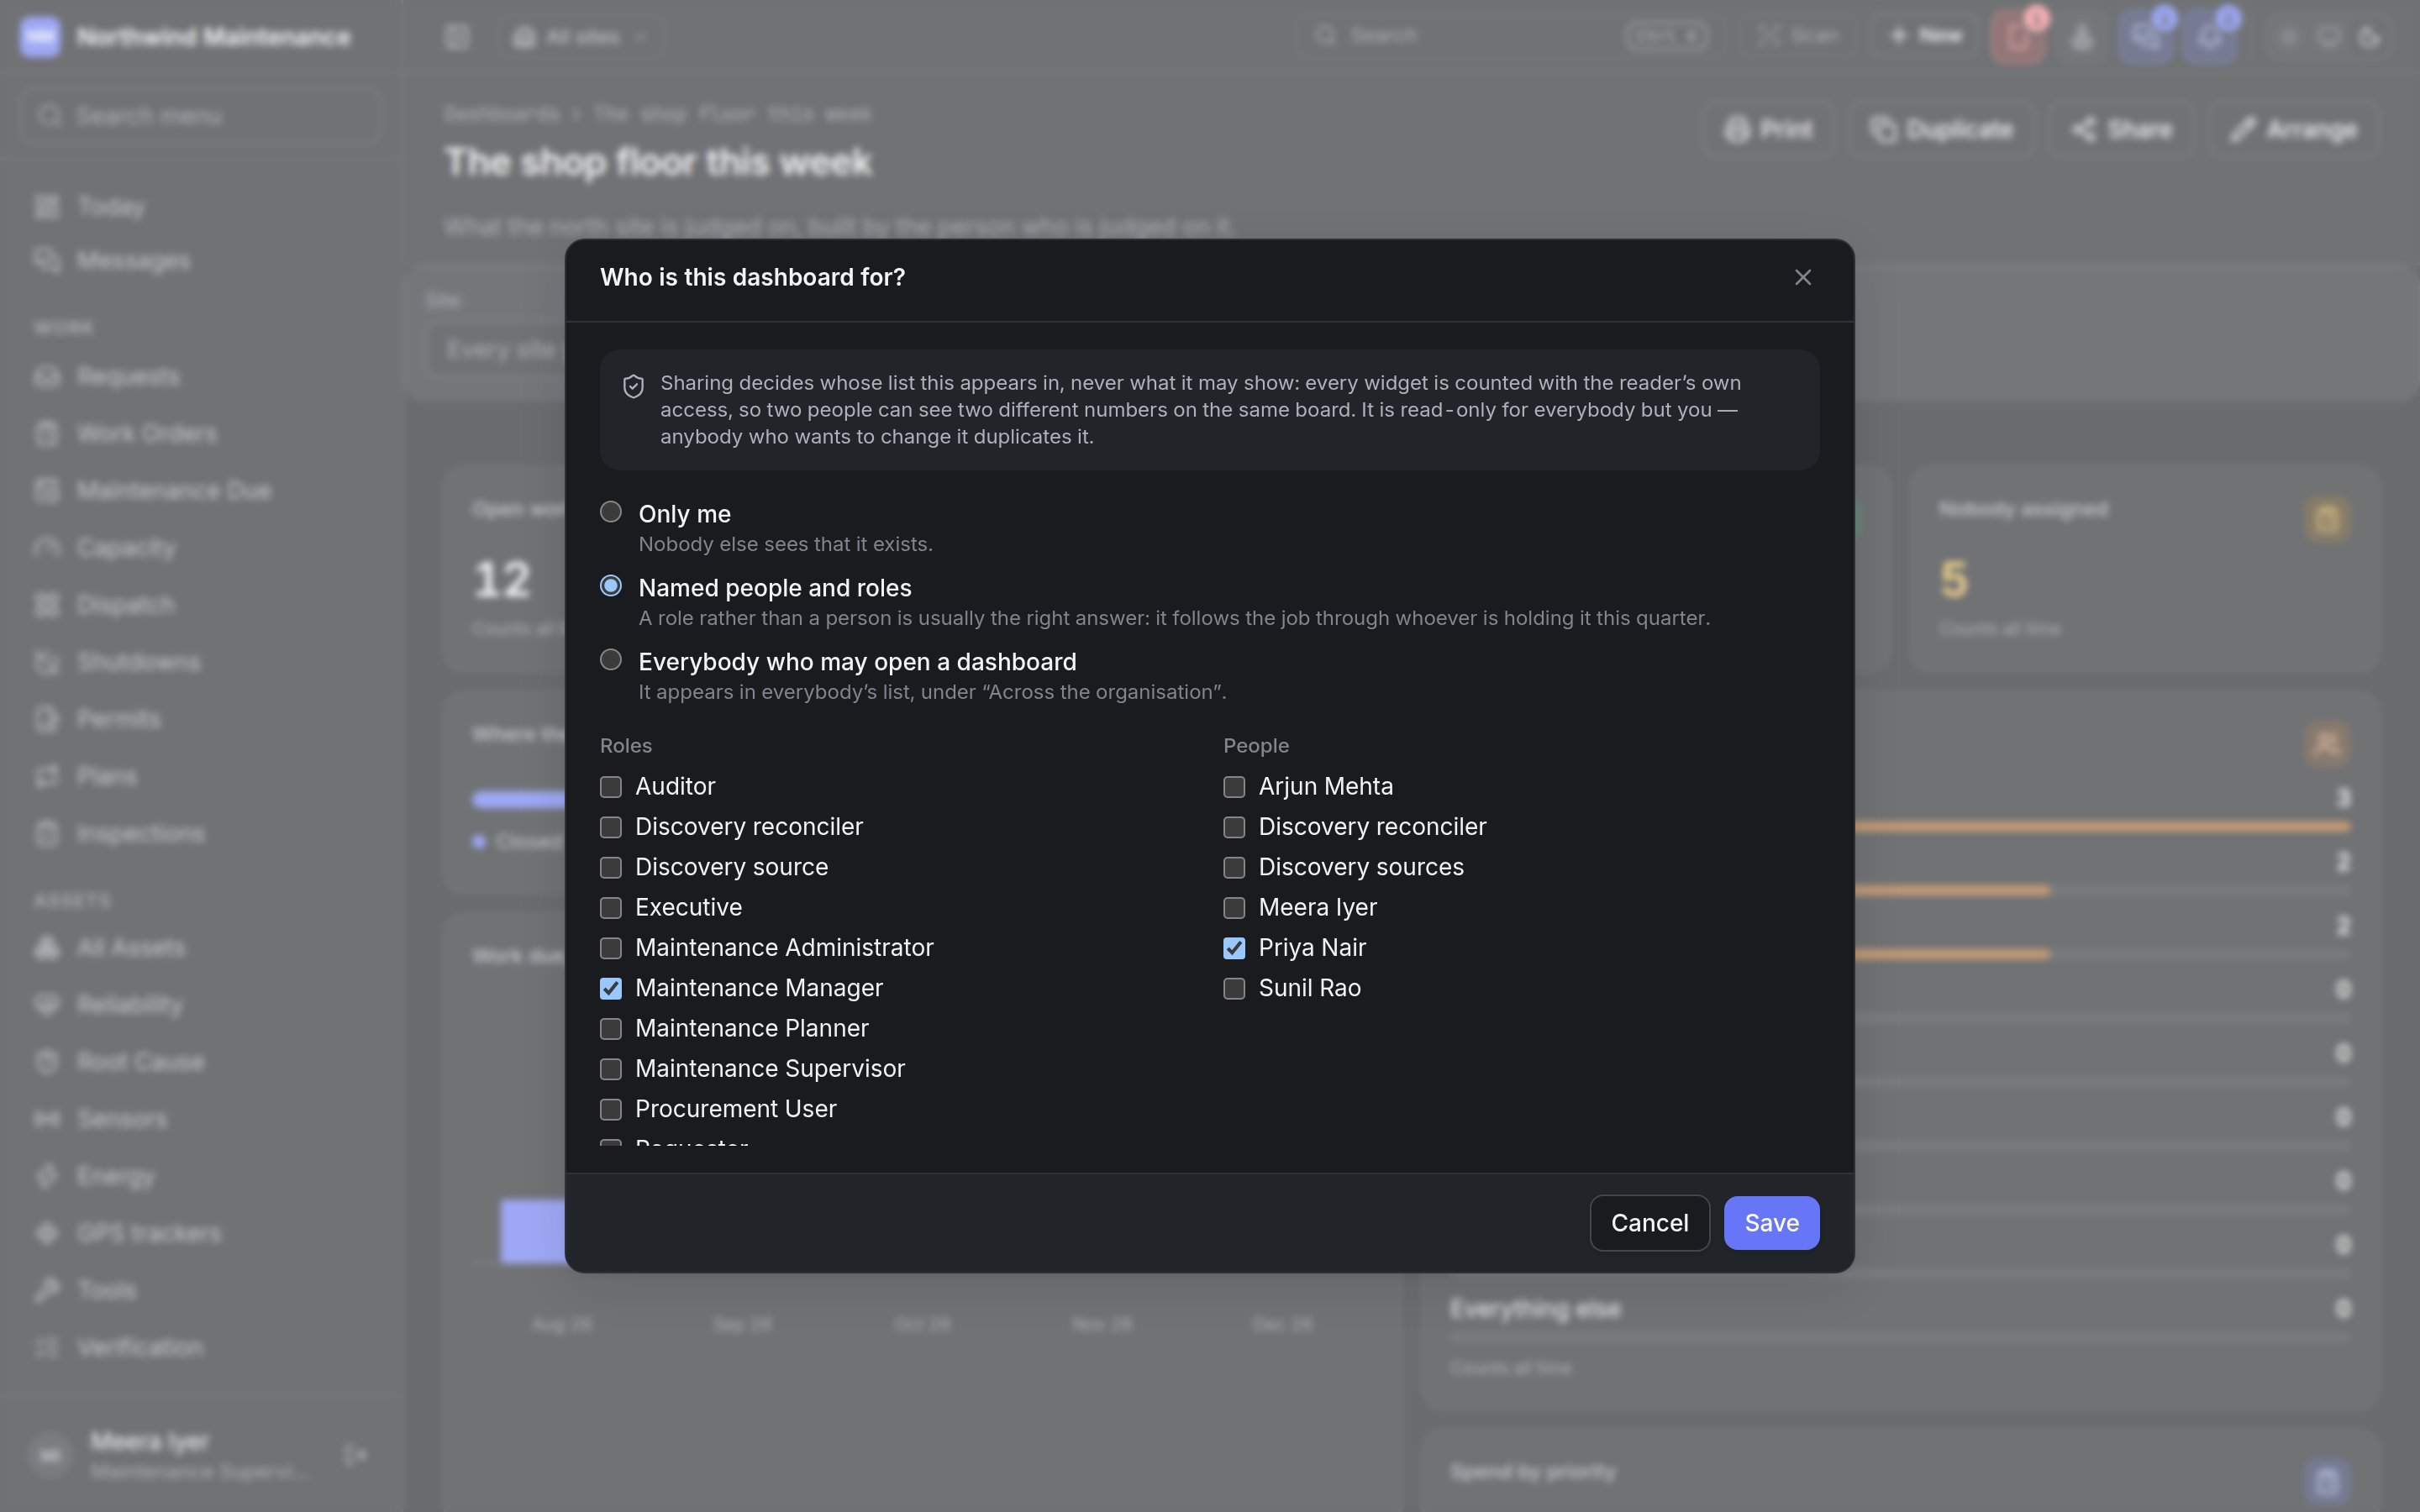 | Choice | What it means | Shown on the card as |
| - | - | - |
| **Only me** | "Nobody else sees that it exists." The default for a new board | **Only you** |
| **Named people and roles** | The board appears under **Shared with me** for each person you tick and for everybody holding a role you tick. Two lists appear — **Roles** and **People** — with a tick box for each | **Shared** |
| **Everybody who may open a dashboard** | The board appears in everybody's list, under **Across the organisation** | **Everyone** |
A role is usually the better choice than a person: it follows the job through whoever holds it this
quarter. **Save** replaces the whole audience in one go.
Nobody you share with can change your board. Anyone who wants a version of their own presses
**Duplicate**.
## Sending a board on a schedule
**Send it on a schedule** (in Arrange mode) opens **Send this dashboard**. A scheduled board is drawn
by the product, saved as a file and sent to each recipient as a notification with a link to it.
| Choice | What it means | Shown on the card as |
| - | - | - |
| **Only me** | "Nobody else sees that it exists." The default for a new board | **Only you** |
| **Named people and roles** | The board appears under **Shared with me** for each person you tick and for everybody holding a role you tick. Two lists appear — **Roles** and **People** — with a tick box for each | **Shared** |
| **Everybody who may open a dashboard** | The board appears in everybody's list, under **Across the organisation** | **Everyone** |
A role is usually the better choice than a person: it follows the job through whoever holds it this
quarter. **Save** replaces the whole audience in one go.
Nobody you share with can change your board. Anyone who wants a version of their own presses
**Duplicate**.
## Sending a board on a schedule
**Send it on a schedule** (in Arrange mode) opens **Send this dashboard**. A scheduled board is drawn
by the product, saved as a file and sent to each recipient as a notification with a link to it.
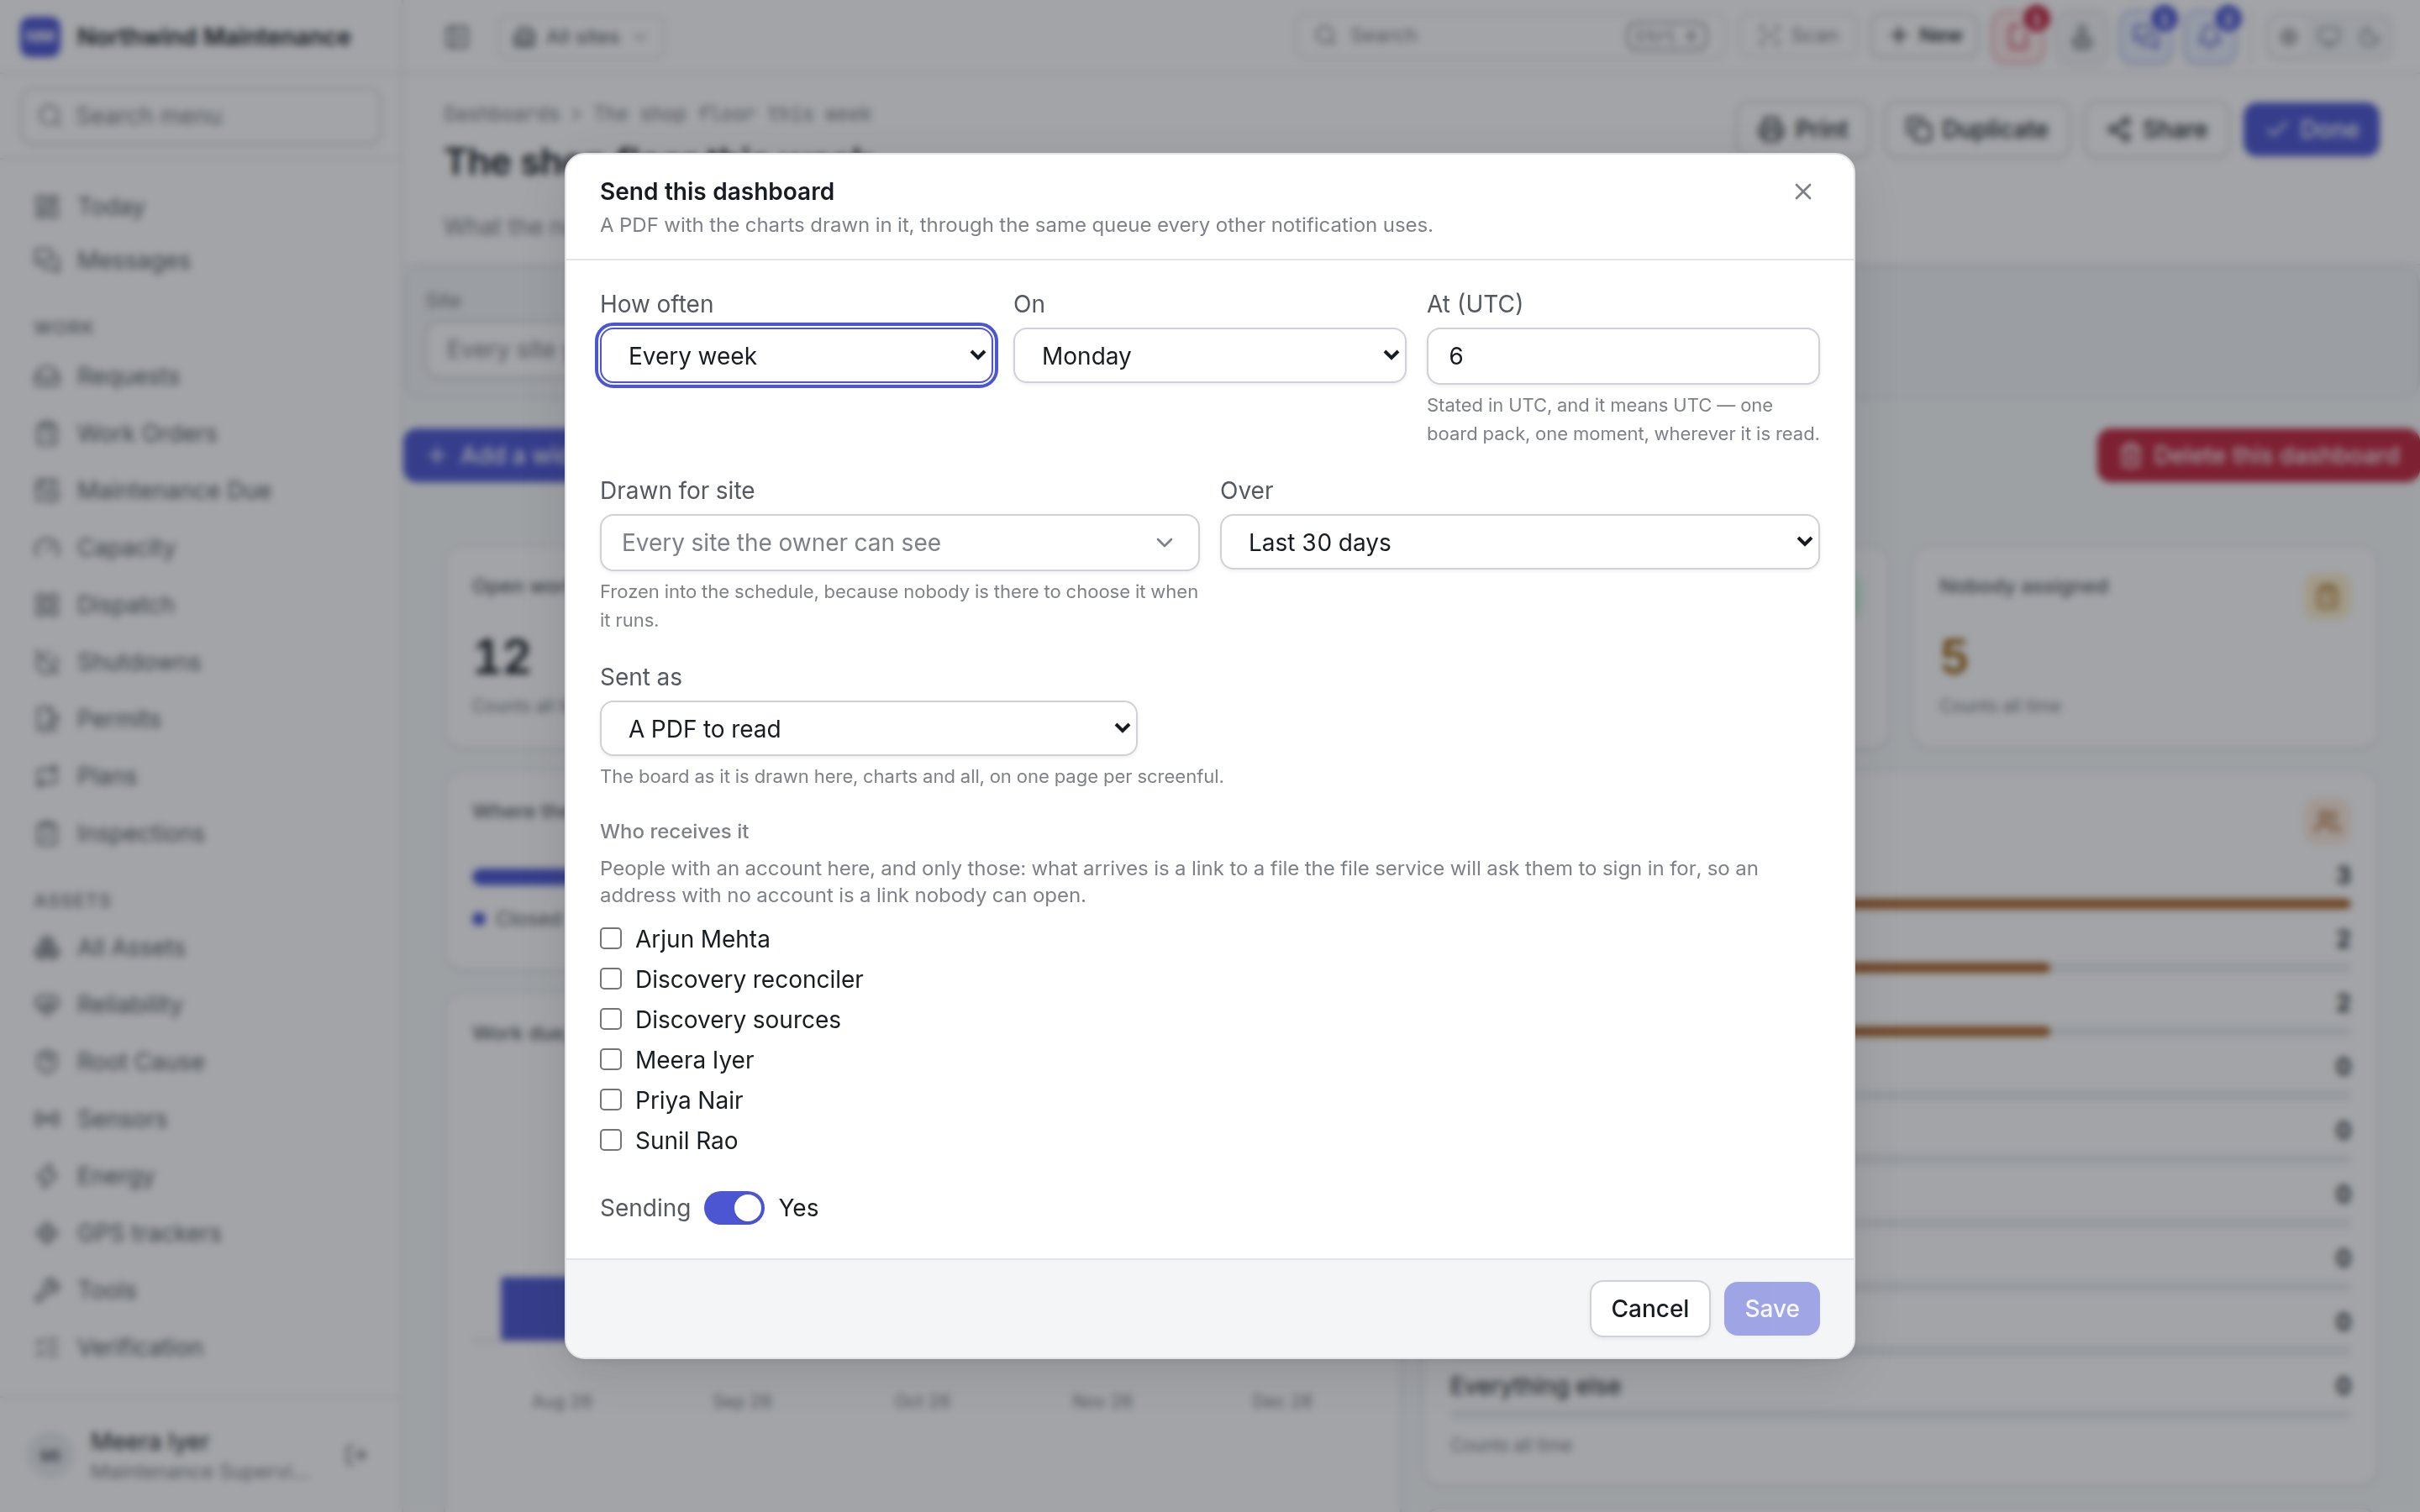
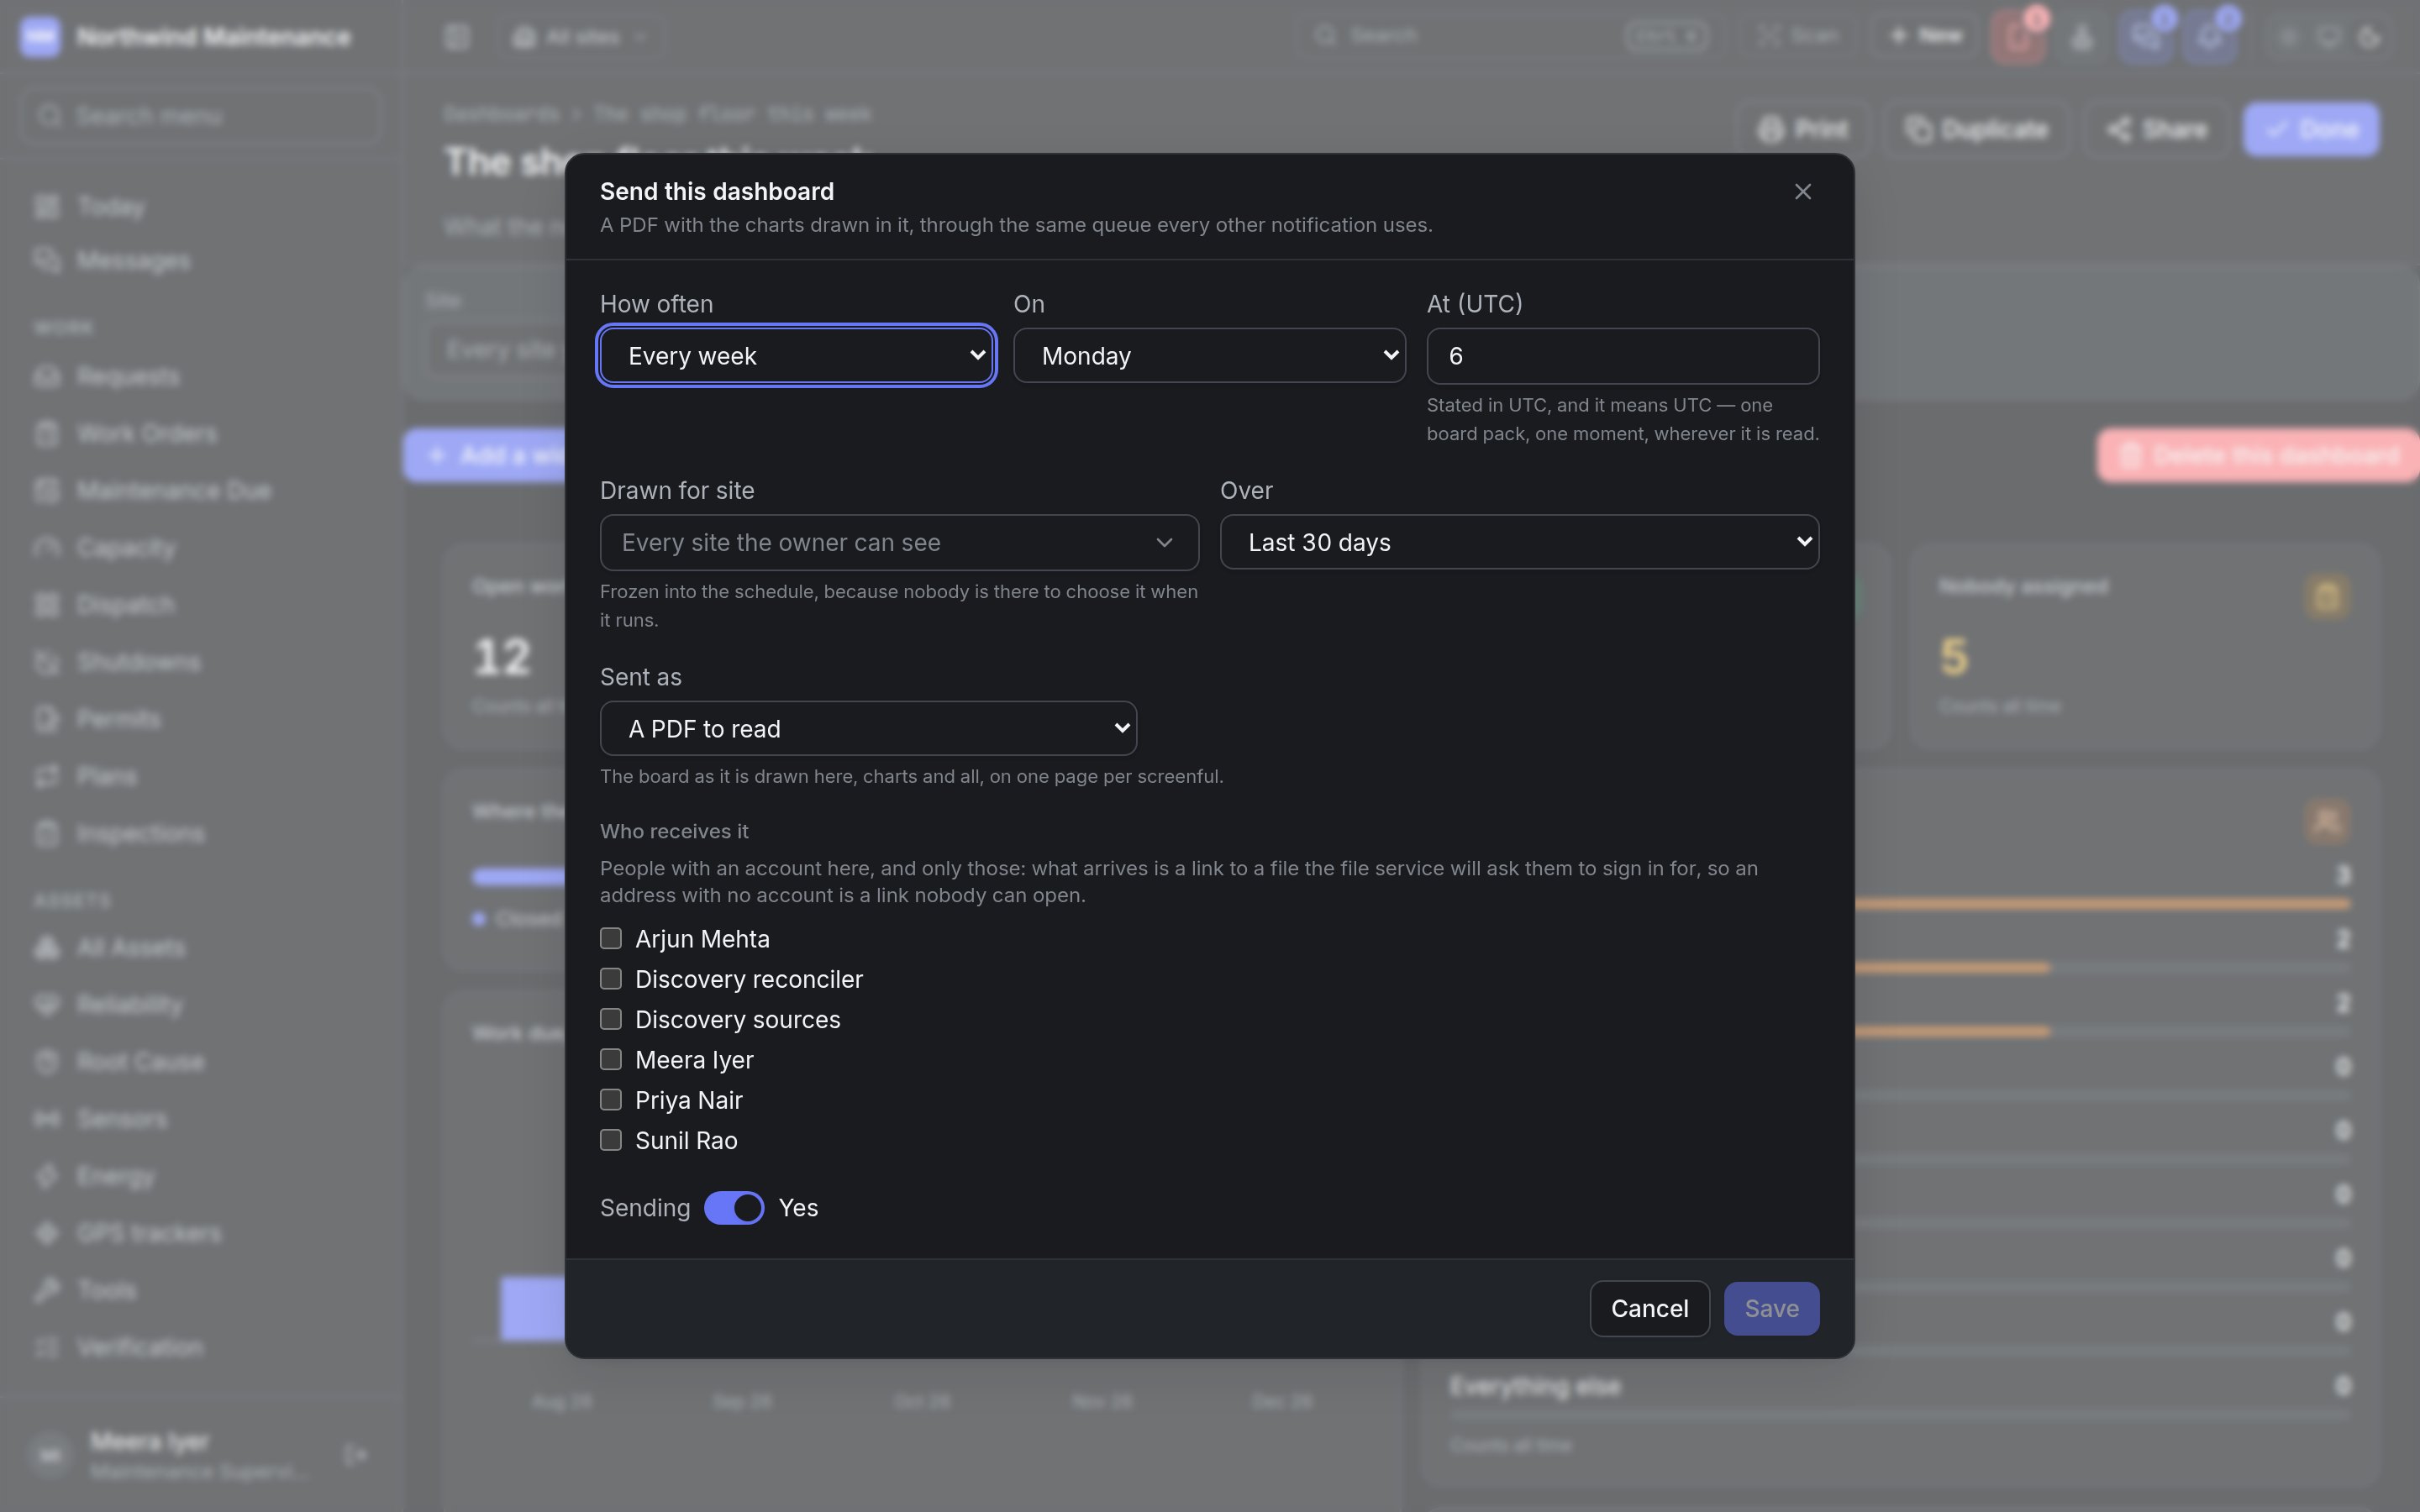 | Field | What it means | Notes |
| - | - | - |
| **How often** | **Every day**, **Every week** or **Every month** | Defaults to **Every week** |
| **On** | The day of the week | Appears for a weekly schedule. Defaults to Monday |
| **Day of the month** | The day of each month it is sent | Appears for a monthly schedule. 1 to 28, "so there is no month it can miss" |
| **At (UTC)** | The hour it is sent, 0 to 23 | Defaults to 6. Stated in UTC and meant in UTC — one board pack, one moment, wherever it is read — so it does not shift when the clocks change |
| **Drawn for site** | The site the copy is drawn for | Opens on the site you are currently looking at. Empty means **Every site the owner can see**. Frozen into the schedule, because nobody is there to choose it when it runs |
| **Over** | The period the copy covers | The same choices as the filter bar. Opens on the period you are looking at |
| **Sent as** | **A PDF to read** — the board as drawn here, charts and all, on one page per screenful; or **A spreadsheet to check** — one sheet per widget with the groups and their figures as rows, and no charts | Defaults to a PDF |
| **Who receives it** | A tick box for each person in your organisation | At least one is required. Only people with an account here: what arrives is a link to a file they sign in to open |
| **Sending** | Whether the schedule is active | On by default. Switch it off to keep the schedule and stop sending |
Editing a schedule (its **Edit** button under the board) opens the same dialog with **Stop sending**,
which deletes the schedule.
### Sent on a schedule
Each schedule is listed under the board with its cadence ("Every week — Monday, 06:00 UTC"), its
recipients, its site and period, and two warnings where they apply:
| Warning | What it means |
| - | - |
| **Will not send — draft** | The board is a draft. Publish it in Arrange mode or nothing will arrive |
| *n* **unknown recipients** | Somebody on the list is no longer a user here. The delivery is refused rather than sent to part of the list |
### What went out
The delivery log under the board answers "did my Monday board go out, and what was in it".
| Column | What it shows |
| - | - |
| **For** | The start of the period the copy covered |
| **Answered with** | Whose access the figures were counted with — "Meera Iyer's access" — or "nobody's — refused" |
| **Widgets** | How many widgets were drawn, and how many failed. A copy that lost two tiles still looks finished, which is why the failures are counted |
| **As** | PDF or XLSX |
| **Sent to** | How many recipients were notified |
| **Status** | **PENDING** (waiting to be drawn), **RENDERED** (drawn, not yet sent), **DELIVERED**, **REFUSED** or **FAILED** |
| **When** | When it was delivered |
| **The file** | Opens the PDF on screen, or downloads the spreadsheet, once the file is ready |
Anything refused or failed is lifted into its own **Not sent** table above the log, with the reason
in a sentence — the owner's account was closed, a recipient is not a user here, the board is still a
draft, it has no widgets, or nobody was named. A schedule that has quietly stopped arriving has no
other symptom, so this is the place to look.
## Related
Saved questions that return rows, which a Table or Pivot table widget can show.
The three built-in boards on the home screen.
This documentation is built and hosted on [Mintlify](https://mintlify.com), a developer documentation platform.
| Field | What it means | Notes |
| - | - | - |
| **How often** | **Every day**, **Every week** or **Every month** | Defaults to **Every week** |
| **On** | The day of the week | Appears for a weekly schedule. Defaults to Monday |
| **Day of the month** | The day of each month it is sent | Appears for a monthly schedule. 1 to 28, "so there is no month it can miss" |
| **At (UTC)** | The hour it is sent, 0 to 23 | Defaults to 6. Stated in UTC and meant in UTC — one board pack, one moment, wherever it is read — so it does not shift when the clocks change |
| **Drawn for site** | The site the copy is drawn for | Opens on the site you are currently looking at. Empty means **Every site the owner can see**. Frozen into the schedule, because nobody is there to choose it when it runs |
| **Over** | The period the copy covers | The same choices as the filter bar. Opens on the period you are looking at |
| **Sent as** | **A PDF to read** — the board as drawn here, charts and all, on one page per screenful; or **A spreadsheet to check** — one sheet per widget with the groups and their figures as rows, and no charts | Defaults to a PDF |
| **Who receives it** | A tick box for each person in your organisation | At least one is required. Only people with an account here: what arrives is a link to a file they sign in to open |
| **Sending** | Whether the schedule is active | On by default. Switch it off to keep the schedule and stop sending |
Editing a schedule (its **Edit** button under the board) opens the same dialog with **Stop sending**,
which deletes the schedule.
### Sent on a schedule
Each schedule is listed under the board with its cadence ("Every week — Monday, 06:00 UTC"), its
recipients, its site and period, and two warnings where they apply:
| Warning | What it means |
| - | - |
| **Will not send — draft** | The board is a draft. Publish it in Arrange mode or nothing will arrive |
| *n* **unknown recipients** | Somebody on the list is no longer a user here. The delivery is refused rather than sent to part of the list |
### What went out
The delivery log under the board answers "did my Monday board go out, and what was in it".
| Column | What it shows |
| - | - |
| **For** | The start of the period the copy covered |
| **Answered with** | Whose access the figures were counted with — "Meera Iyer's access" — or "nobody's — refused" |
| **Widgets** | How many widgets were drawn, and how many failed. A copy that lost two tiles still looks finished, which is why the failures are counted |
| **As** | PDF or XLSX |
| **Sent to** | How many recipients were notified |
| **Status** | **PENDING** (waiting to be drawn), **RENDERED** (drawn, not yet sent), **DELIVERED**, **REFUSED** or **FAILED** |
| **When** | When it was delivered |
| **The file** | Opens the PDF on screen, or downloads the spreadsheet, once the file is ready |
Anything refused or failed is lifted into its own **Not sent** table above the log, with the reason
in a sentence — the owner's account was closed, a recipient is not a user here, the board is still a
draft, it has no widgets, or nobody was named. A schedule that has quietly stopped arriving has no
other symptom, so this is the place to look.
## Related
Saved questions that return rows, which a Table or Pivot table widget can show.
The three built-in boards on the home screen.
This documentation is built and hosted on [Mintlify](https://mintlify.com), a developer documentation platform.