

If you don’t see this in your navigation, your administrator can switch the module on under Administration → Modules, or it may not be included in your plan.
How the forecast is built
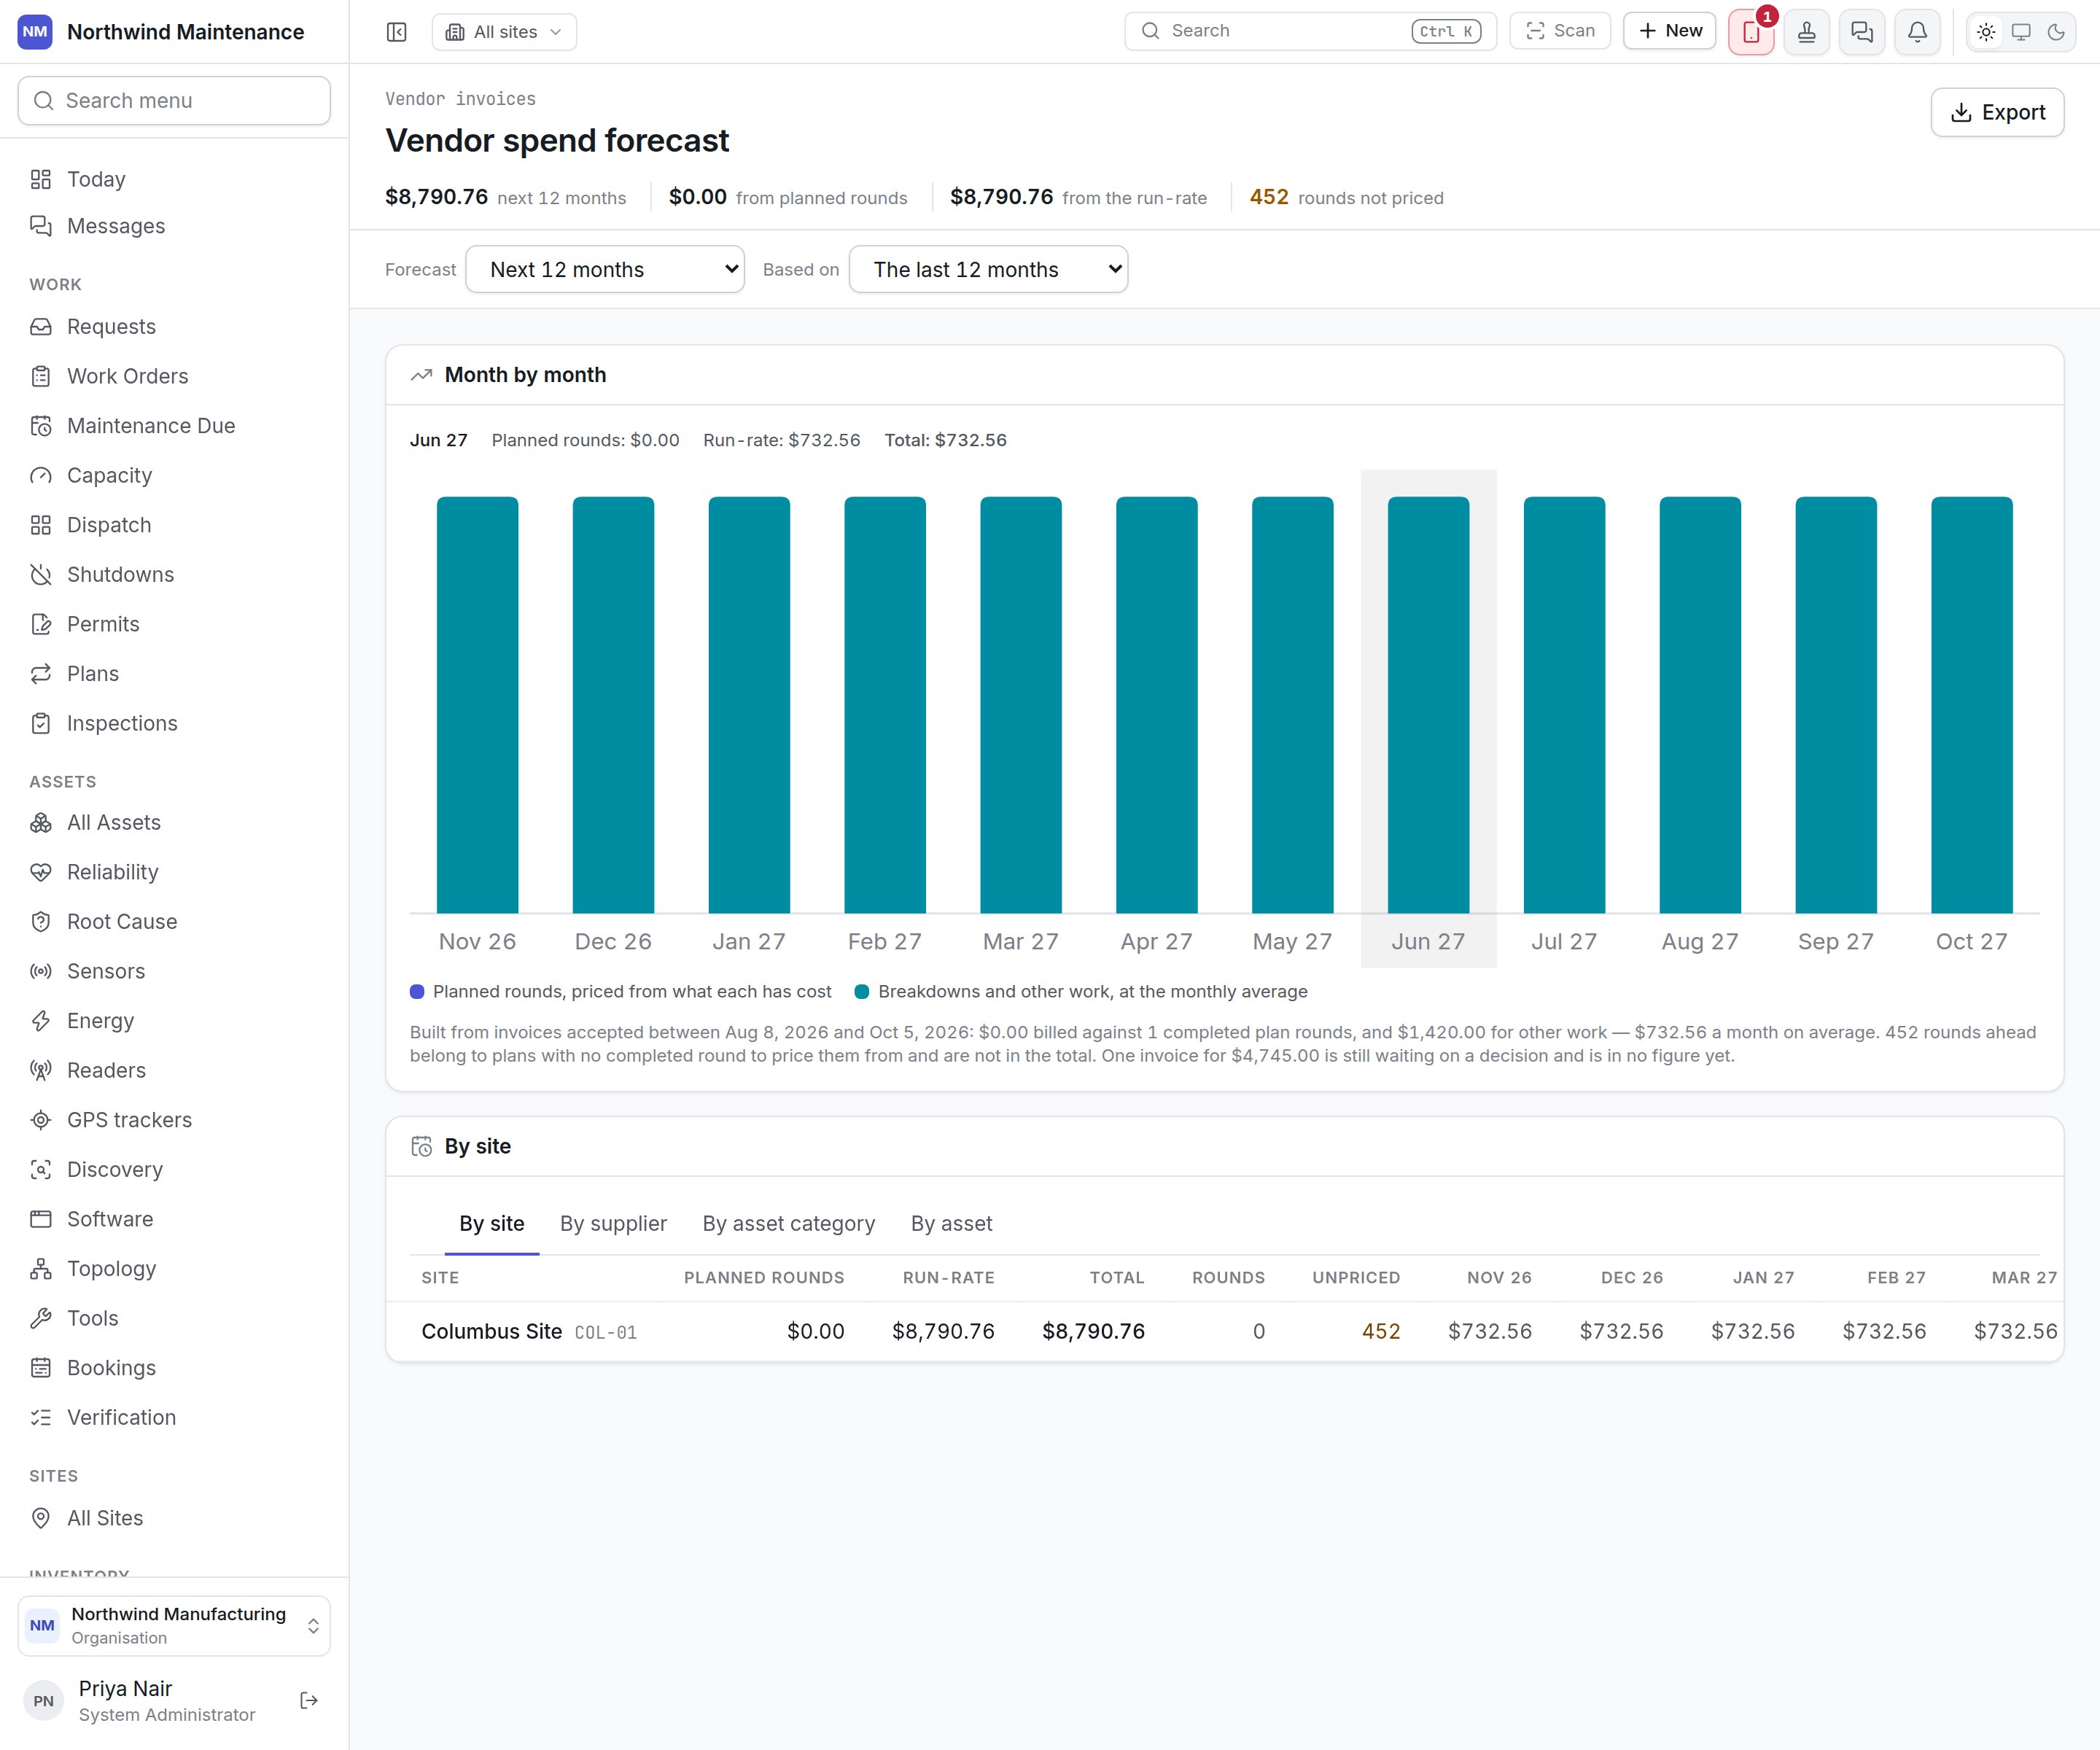
Only invoices a buyer has accepted count. An invoice still awaiting a decision is in no figure, and the explanation under the chart says so.
The two halves are drawn as separate colours in each bar and never blended, because a dated round and an average deserve different levels of confidence.
Rounds not priced counts future rounds that belong to plans with no completed round in the look-back, so nothing says what they will cost. They are left out of every total rather than guessed — read this figure before trusting the total.
Stat strip and controls
Month by month
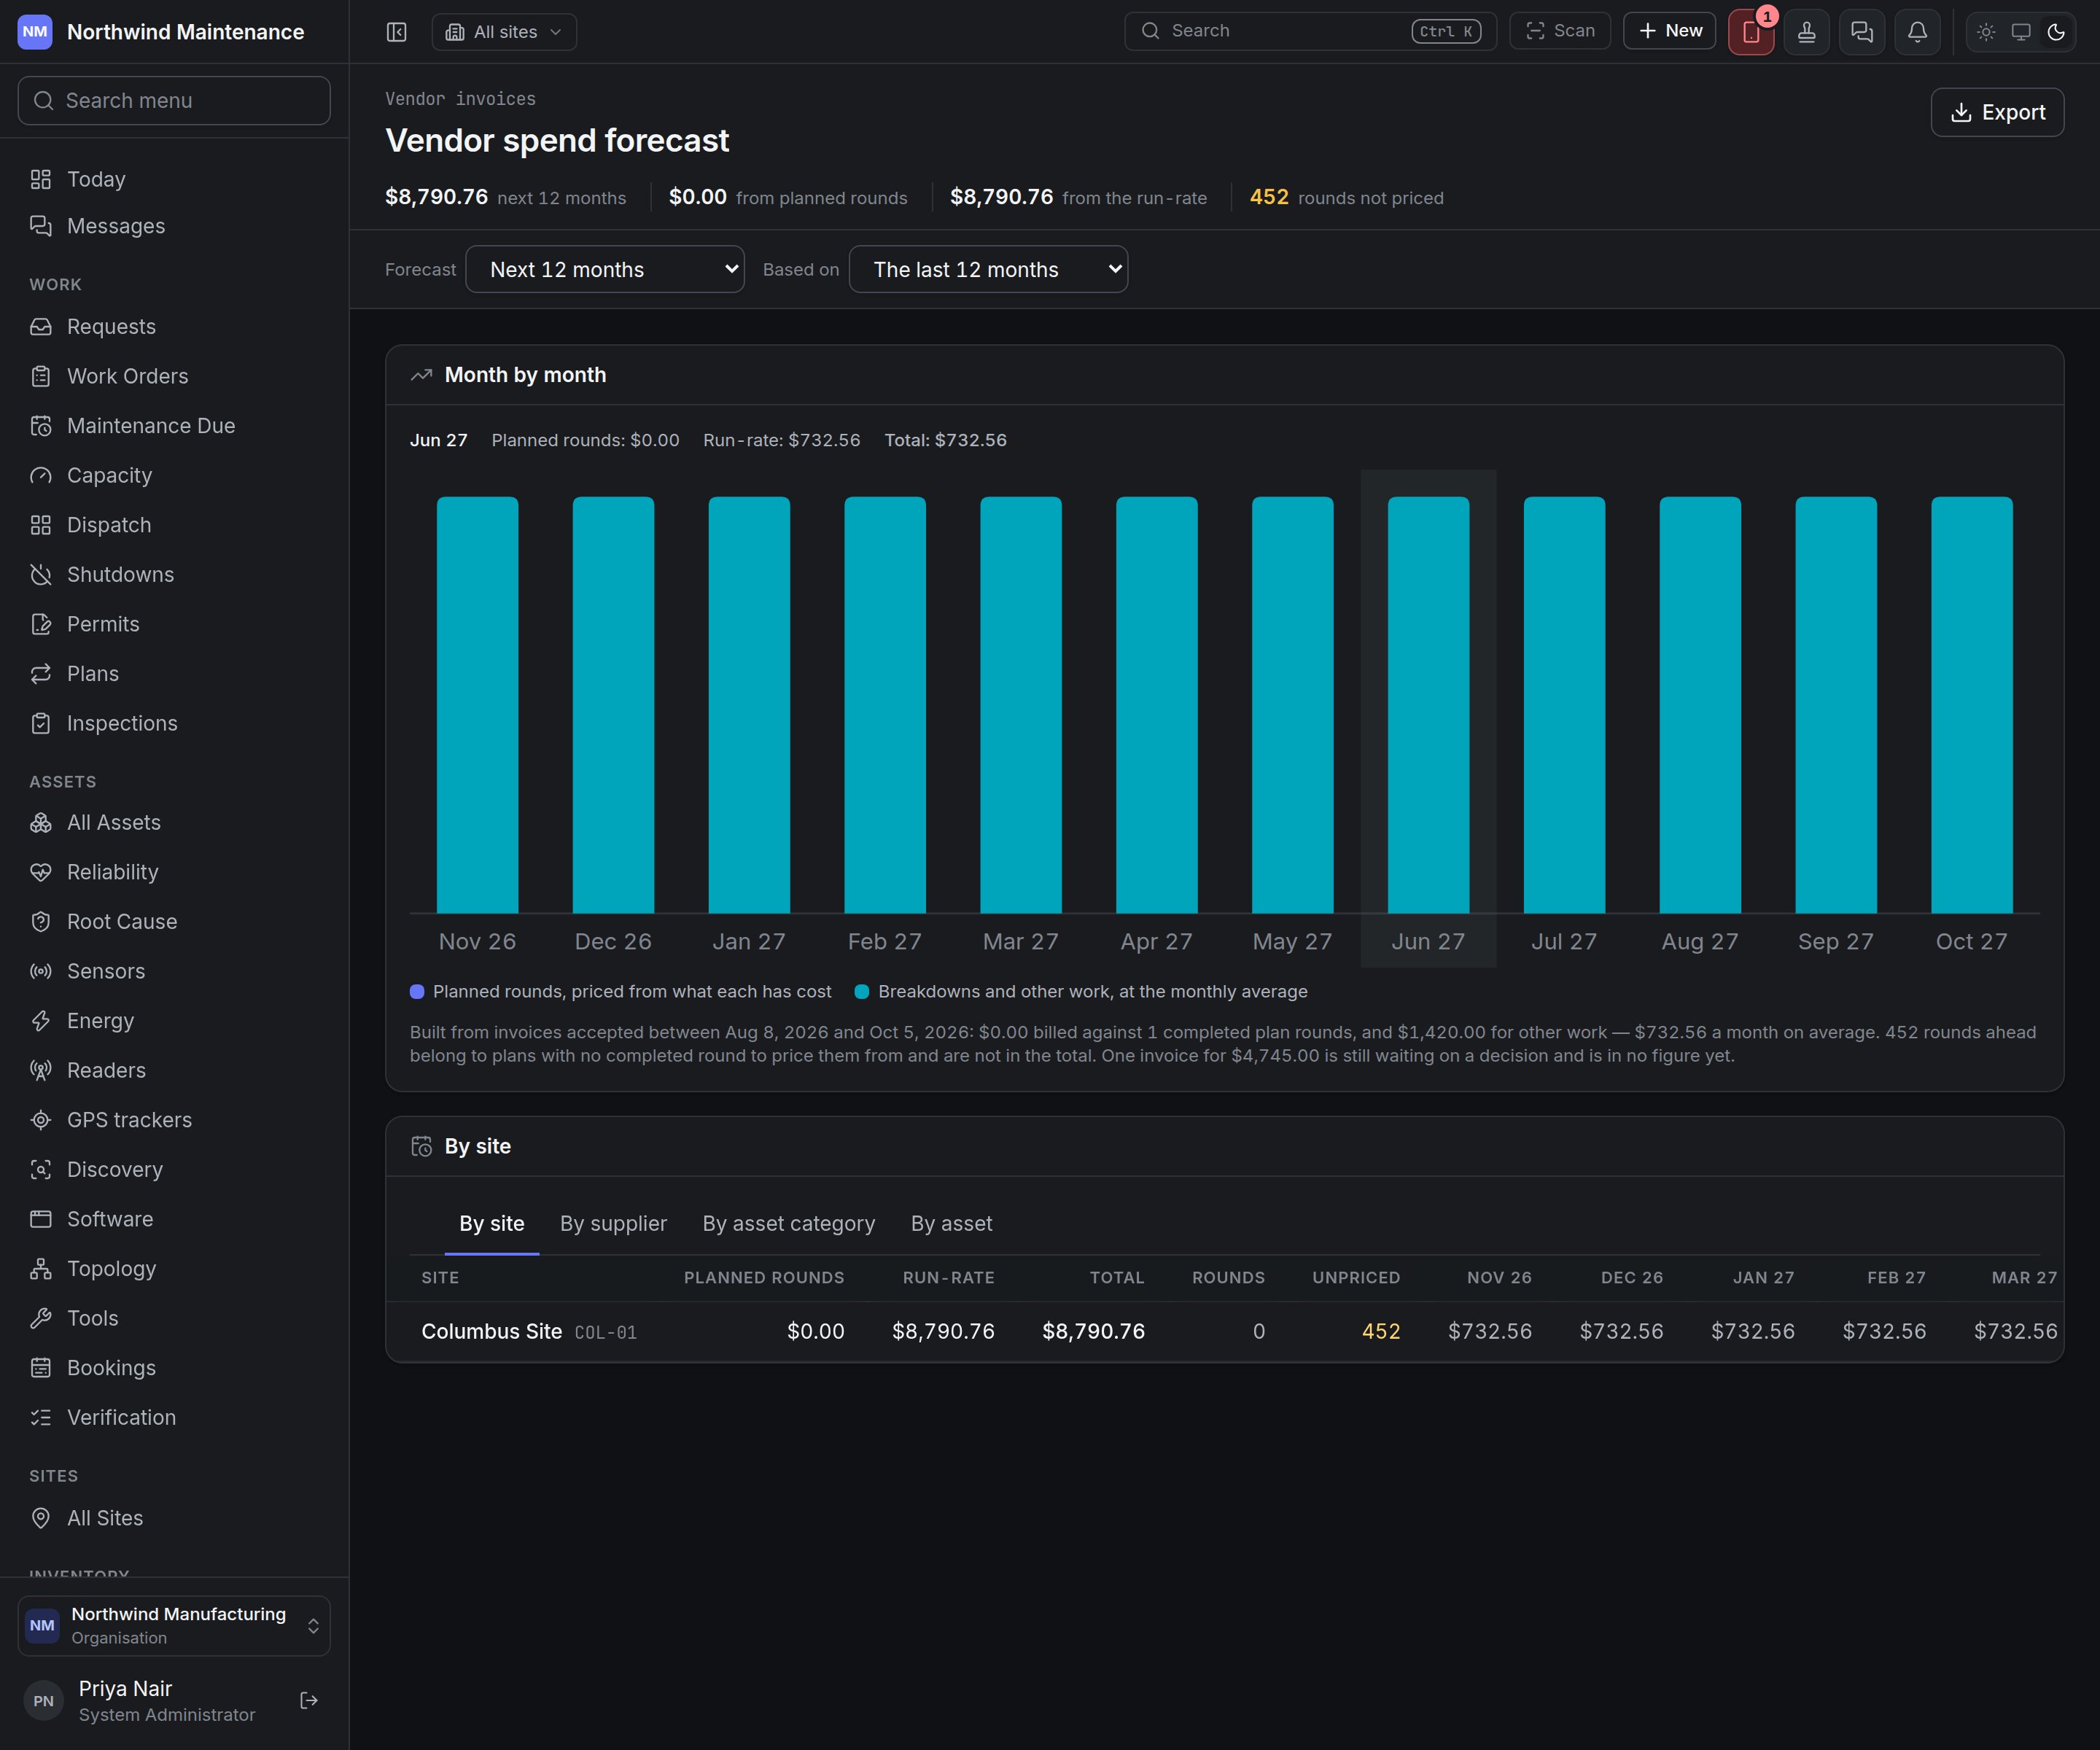
A stacked bar per month. Point at a month to see its Planned rounds, Run-rate and Total. Below the chart, a sentence states exactly what the forecast was built from: the date range of accepted invoices, how much was billed against how many completed plan rounds, how much for other work, the monthly average, and any invoices still waiting on a decision.Breakdown table
Choose how to slice the forecast:
Every row shows Planned rounds, Run-rate, Total, Rounds, Unpriced and one column per month.
The forecast is deliberately not drawn against a budget line. An operating budget head covers labour,
parts and everything else the shop spends; contractor spend is one slice of it, and comparing a slice
with the whole would make every month look comfortably under budget. Use Budgets
for that comparison.
Vendor invoices
The accepted invoices this forecast is built from.
Budgets
Where the money is actually set aside.