

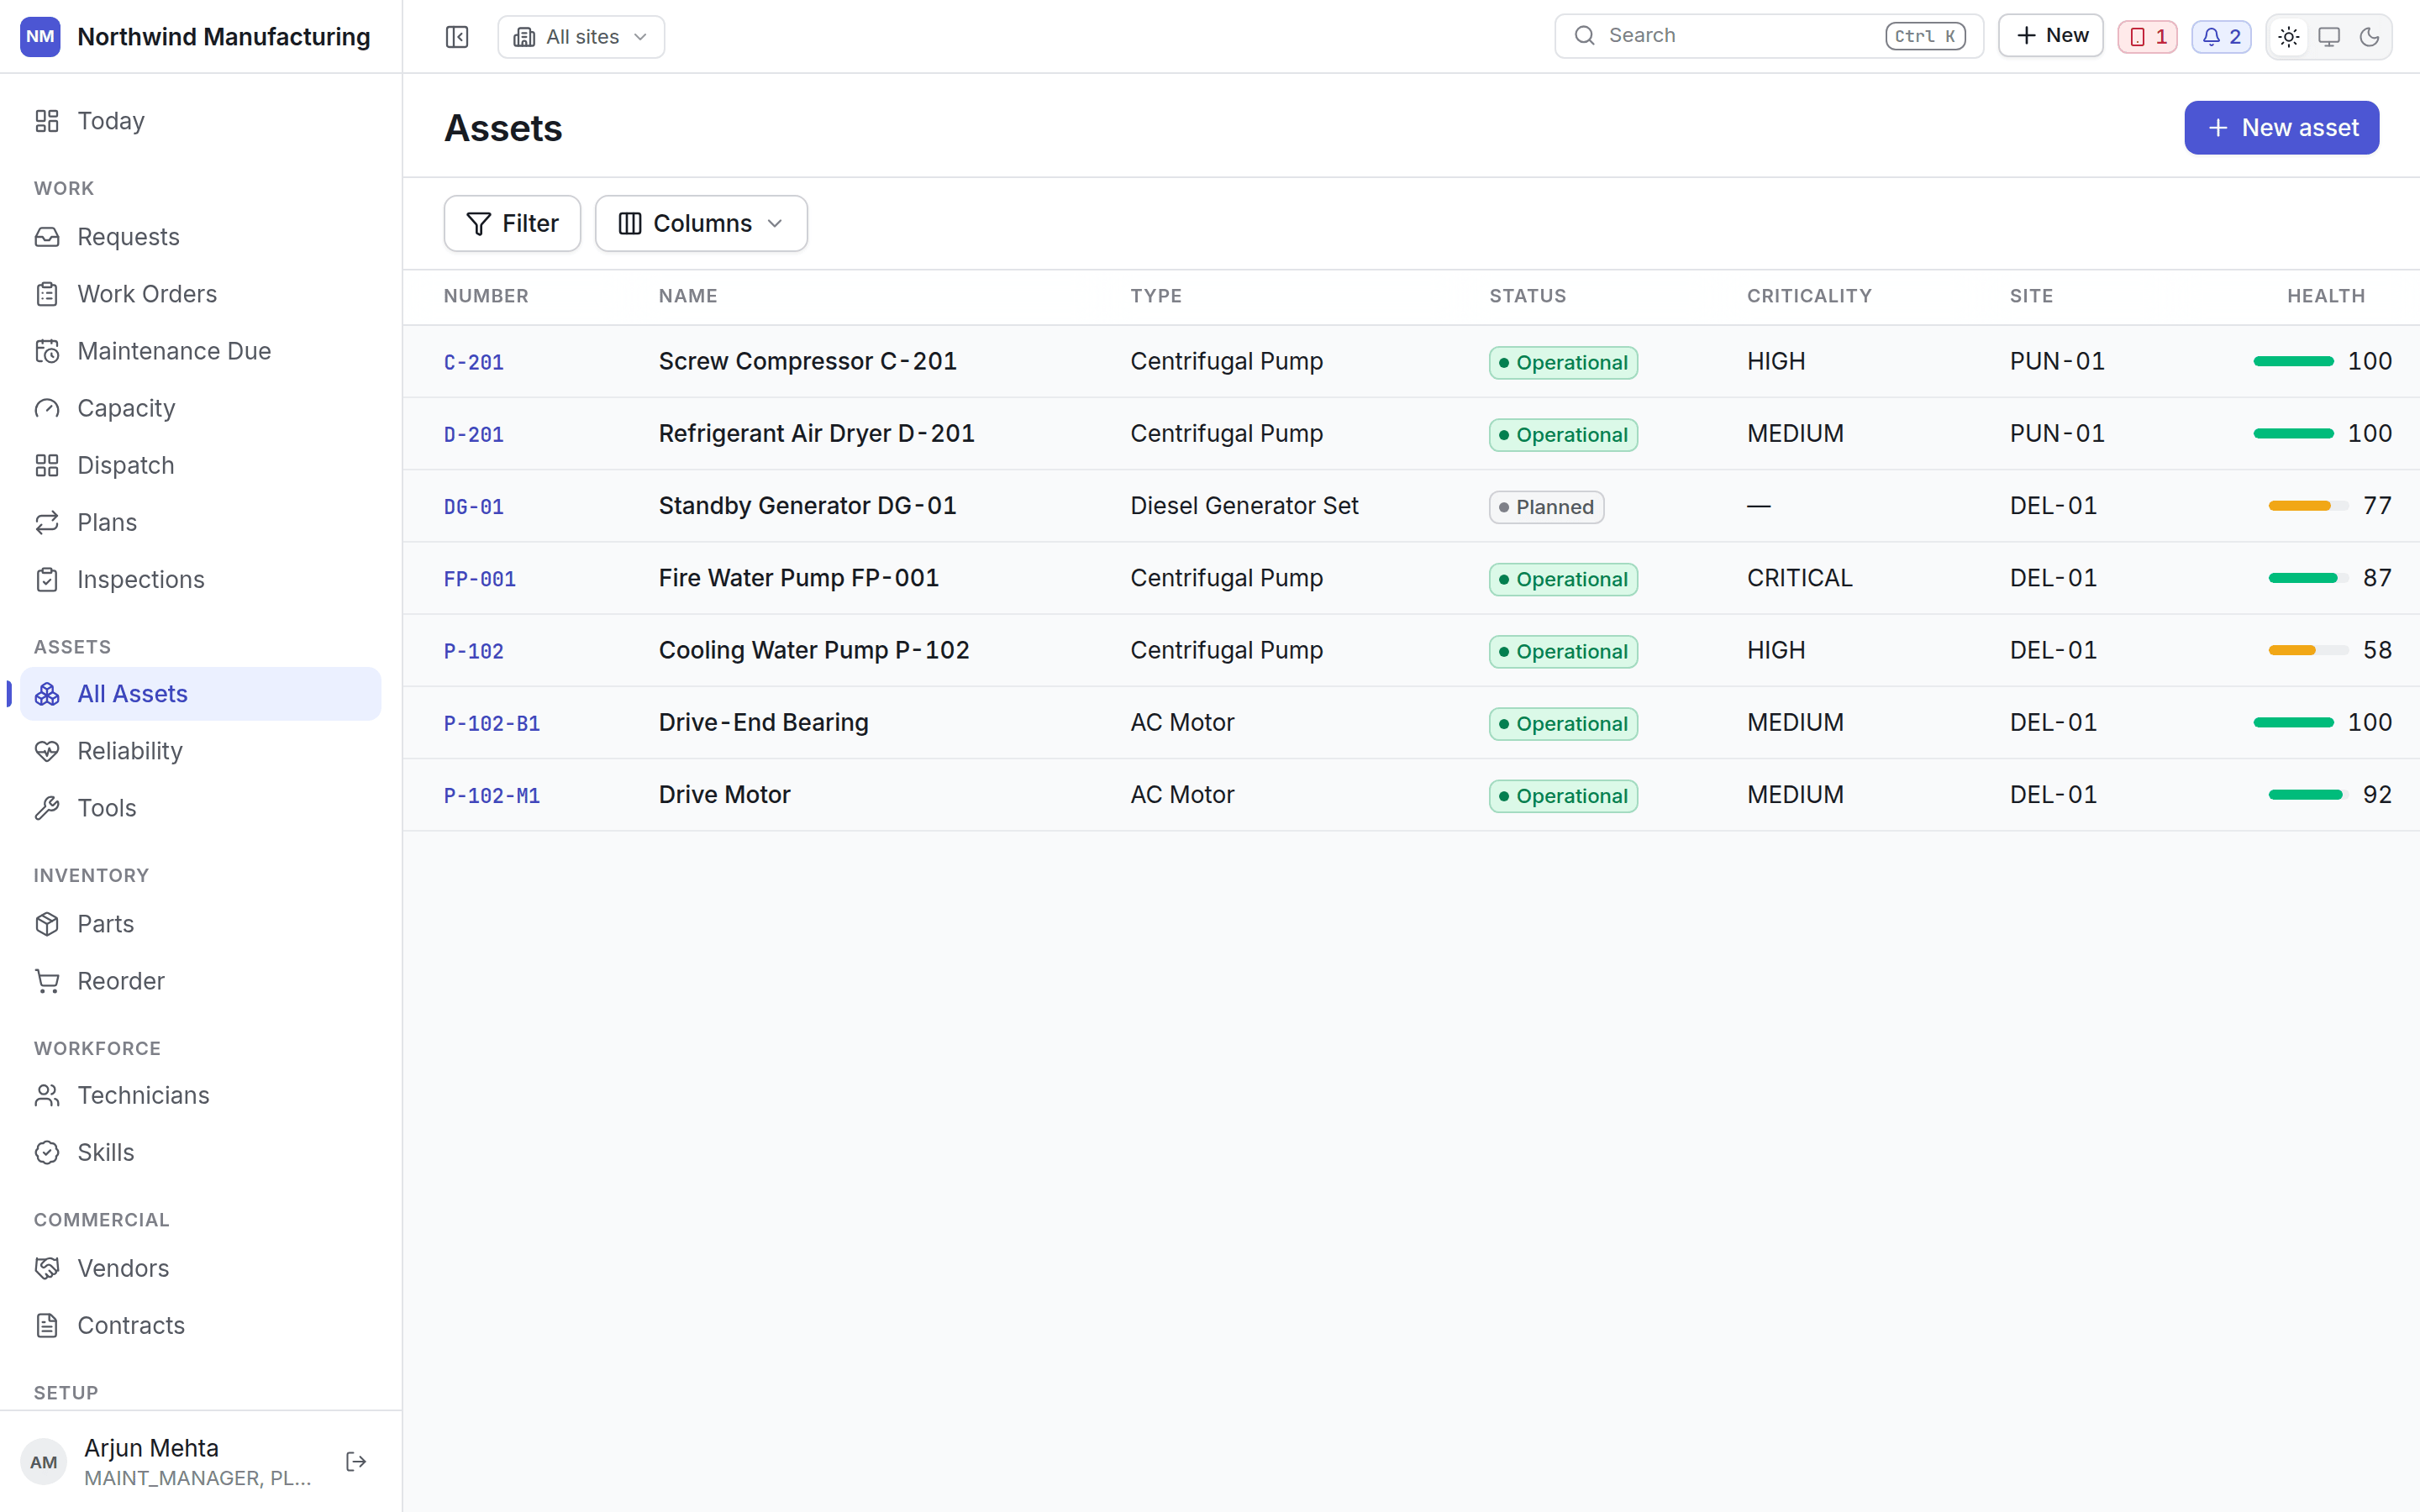
Tabs
Four tabs, each its own URL. Bookmark the one you live in; link straight to it from anywhere else.Columns
Search, filter, choose columns and export as on any list.
Bulk actions
A checkbox column selects rows. Select all N and Select none in the header work across the whole filtered list, not just the page on screen. Selecting anything opens a bulk-action bar:A batch is not all-or-nothing. If one asset in the selection can’t take the action — a status
transition it doesn’t allow, a field it doesn’t have — that asset is reported as a failure and the
rest of the batch still goes through.
The Tree tab
The hierarchy laid out as one list: site, then locations nested as deep as you’ve built them, then assets, then child assets, then each asset’s bill of materials. Five levels, one expandable tree.- Expand or collapse any branch.
- Toggle whether retired assets show.
- Toggle whether parts show at all.
- Search surfaces matching rows plus their ancestors, so a matched part still shows the asset, location and site it hangs off.
No column sorting and no per-column server-side filters here, unlike the other tabs — sorting or
filtering rows independently would break the tree they sit in. Search and the toggles above are
how you narrow the view instead.
The Map tab
Every in-service asset, plotted. An asset uses its own location’s coordinates if the location has them set; otherwise it falls back to its site’s coordinates, and the pin tells you which. Assets that land on the same point fan out into a ring rather than stack invisibly. A count at the side shows how many assets couldn’t be placed at all. The map and basemap handling here is shared with the Dispatch map.The hierarchy
Assets form a tree. A bearing belongs to a pump; the pump sits on a production line; the line is in a building; the building is at a site. The tree is not decoration — work, cost, downtime and failures roll up it. A bearing that fails four times is also four failures on the pump, which is how a component problem becomes visible as a machine problem. Set an asset’s parent on the asset itself. See the whole tree on the Hierarchy tab of any asset, or laid out in full on the Tree tab above.Adding an asset
New on this screen, or New → Create Asset in the header.
Manufacturers, models, types, categories and criticality levels are configured once under
asset settings.
Fill from a document
A button on the Create Asset form reads the machine for you: photograph a nameplate, or upload a PDF or image, and matching fields fill in automatically. Each field it fills carries a small “read” marker until you touch it, so you can tell what the machine told you from what you typed. Nothing is saved until you press Create — reading a document only ever proposes values. A companion microphone button does the same job by ear: describe the asset out loud, and the transcription runs through the same fill pipeline.Criticality
Criticality says how much it matters when this machine stops. It drives the priority of work raised against it, how routing ranks candidates, and how Reliability weighs a failure. Configure the scale under asset settings.Inside an asset
The fifteen tabs on a machine.