

Why it is a separate screen
The due list cannot make a claim about capacity. If it wore capacity colours, “eleven rounds on Tuesday” would read as “Tuesday is full” — which the due list has no basis to say. So the two are separate screens.How it counts
Every figure is computed in man-minutes against the roster: the hours your technicians are actually rostered for, not a headcount. “A four-hour job for two fitters is eight hours of the day.” Supplier work is counted apart, because it is somebody else’s roster. Only work with an estimated duration can be weighed. A job or round with no estimate still appears in the day’s list, but adds nothing to its hours — the foot of the screen says how many there are (“2 jobs have no estimate, so they count towards the day’s list and not towards its hours.”). If the plan looks emptier than the workshop feels, the usual cause is plans and jobs with no duration on them. Open jobs with no date at all sit outside the plan; the foot of the screen counts them too, with a link to them. The site switcher at the top decides which sites are shown. Sites are never blended: technicians are rostered at a site and cannot absorb another site’s load, so an average across three sites would hide the one that is drowning.Narrowing the plan
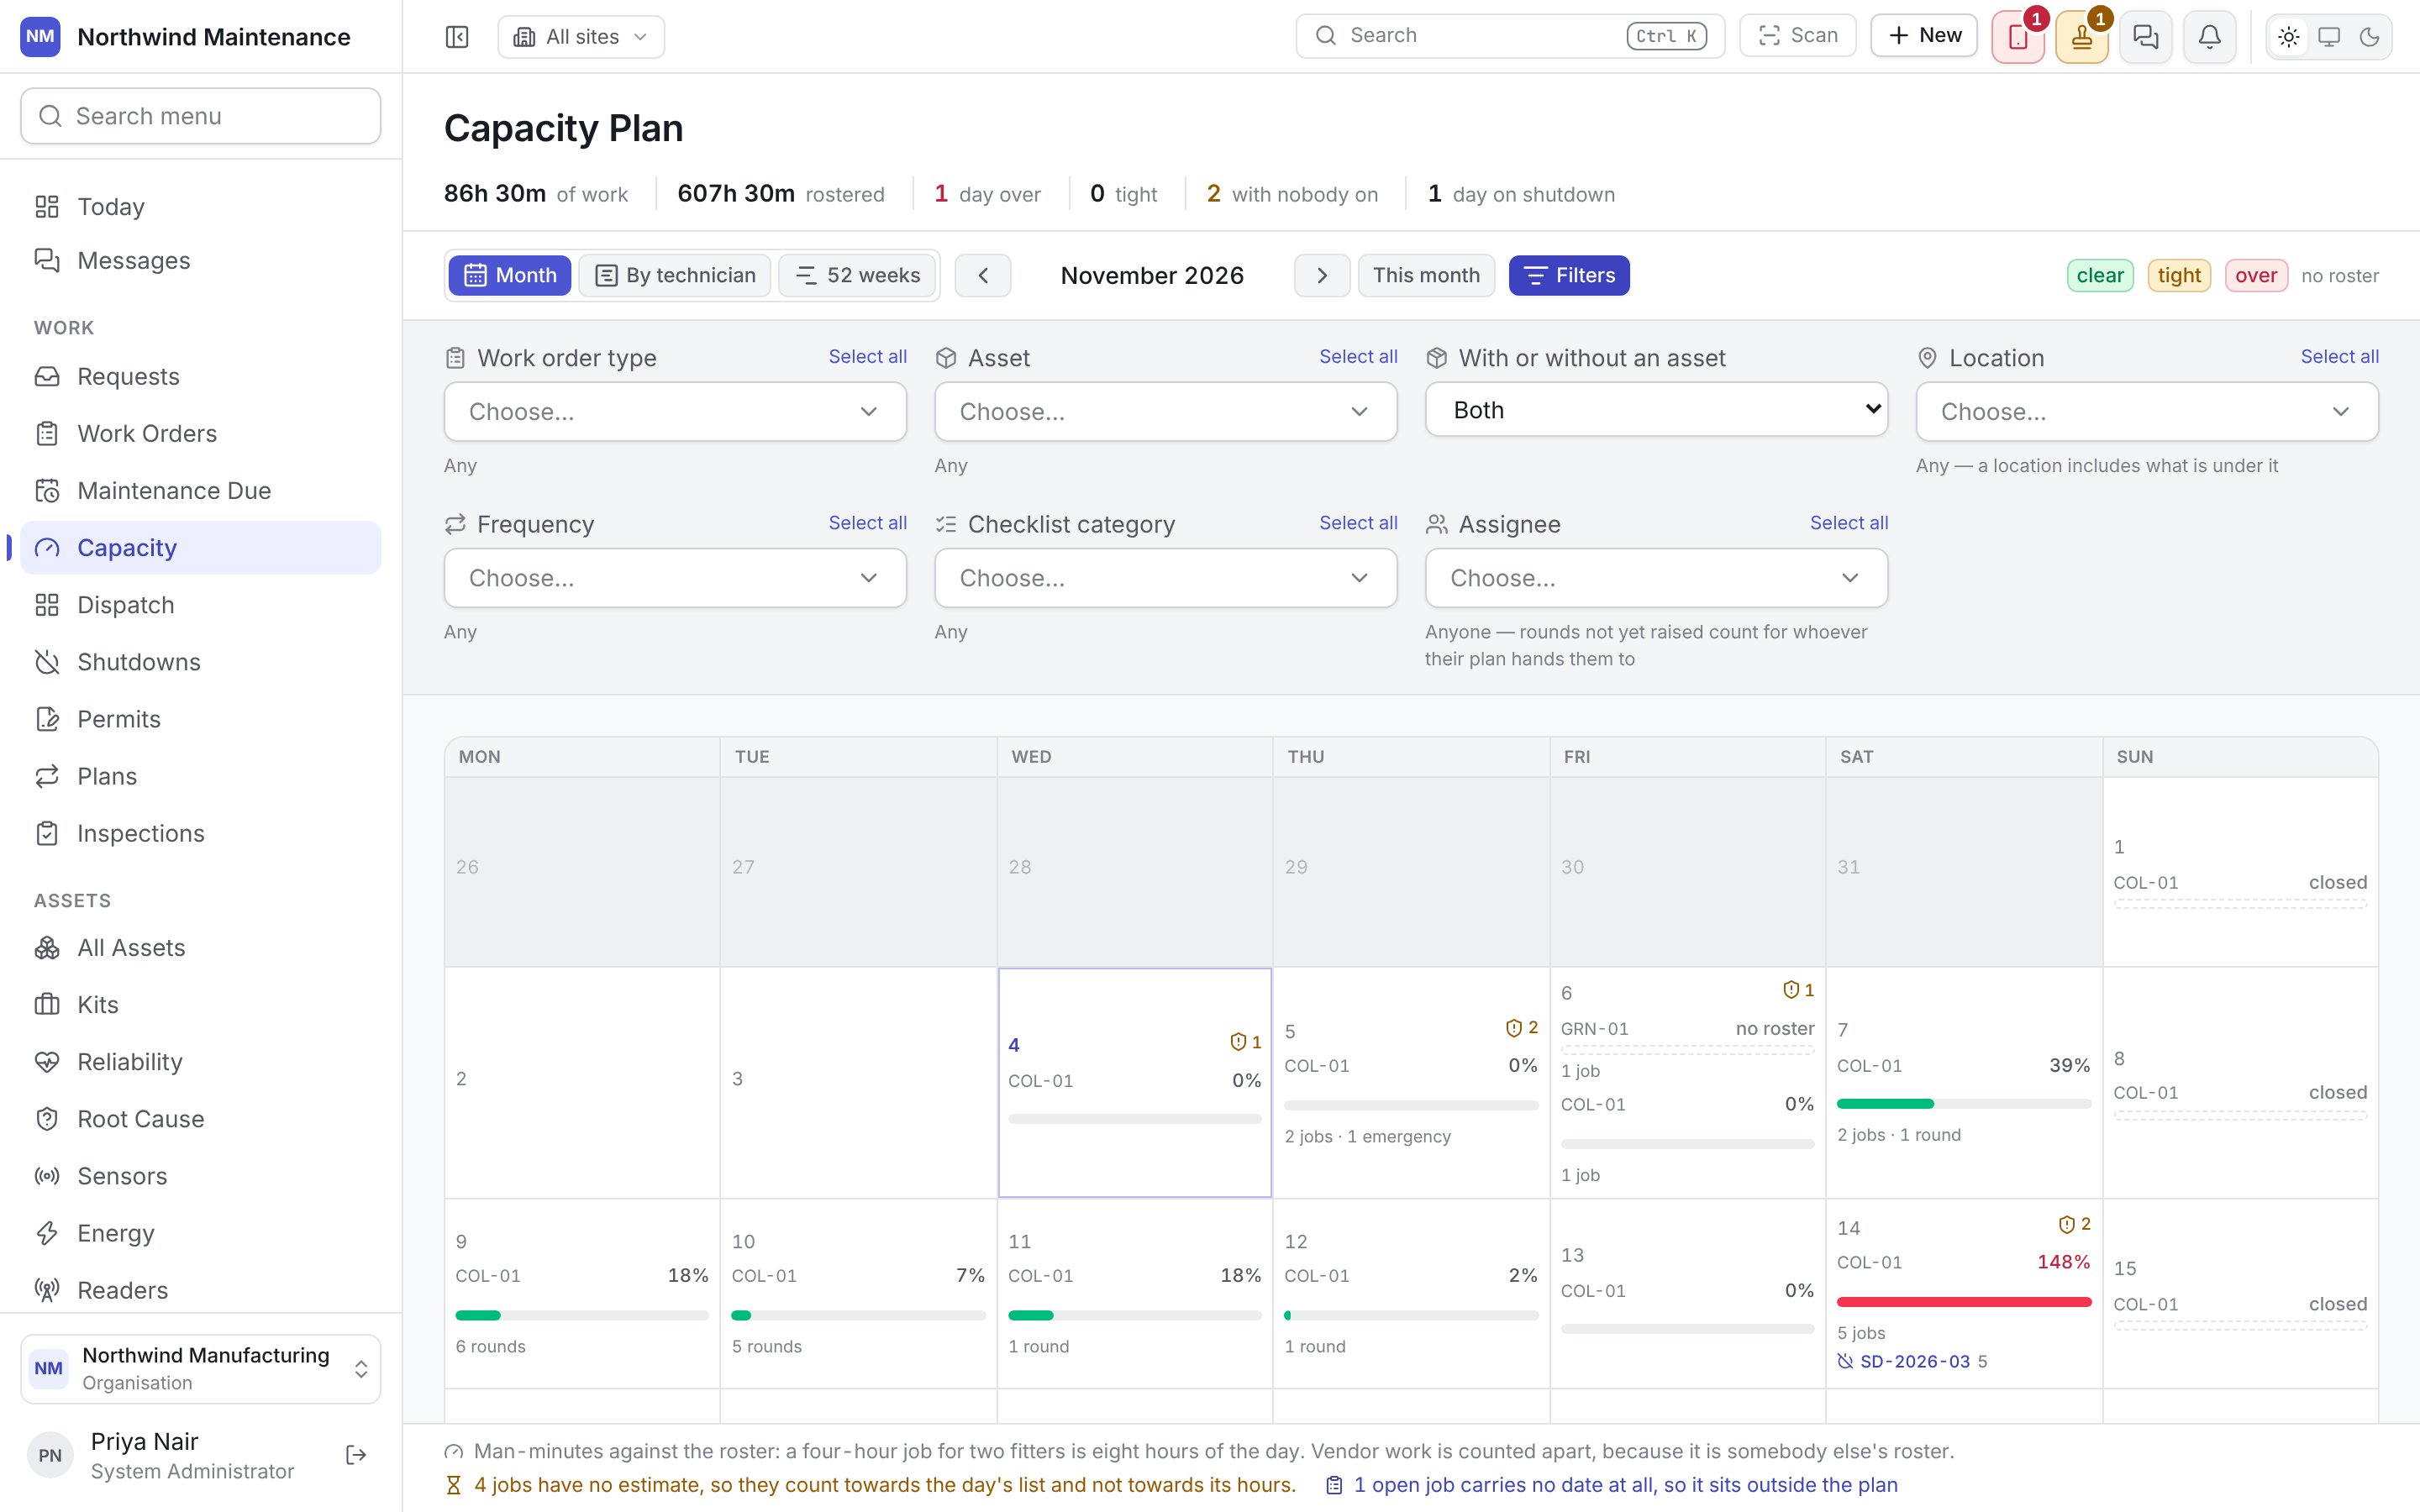
The filters apply to all three views — Month, By technician and 52 weeks — and to every figure on them: the summary line, the cells, the load line, a single day and the breakdown tables are all counted from the narrower set, job by job, before anything is added up. The button shows how many filters are set. With the panel folded away, a line headed Showing only keeps naming what the plan is narrowed to, because every total on the page is about less than it would otherwise be. Clear filters removes them all. Where nothing matches, the view says so and suggests clearing a filter or moving the window.
A round merged into a less frequent one by activity merge — a monthly done by the annual service’s visit — stays out of the plan even when the annual is filtered out, so filtering never brings back work that would not happen.
Month
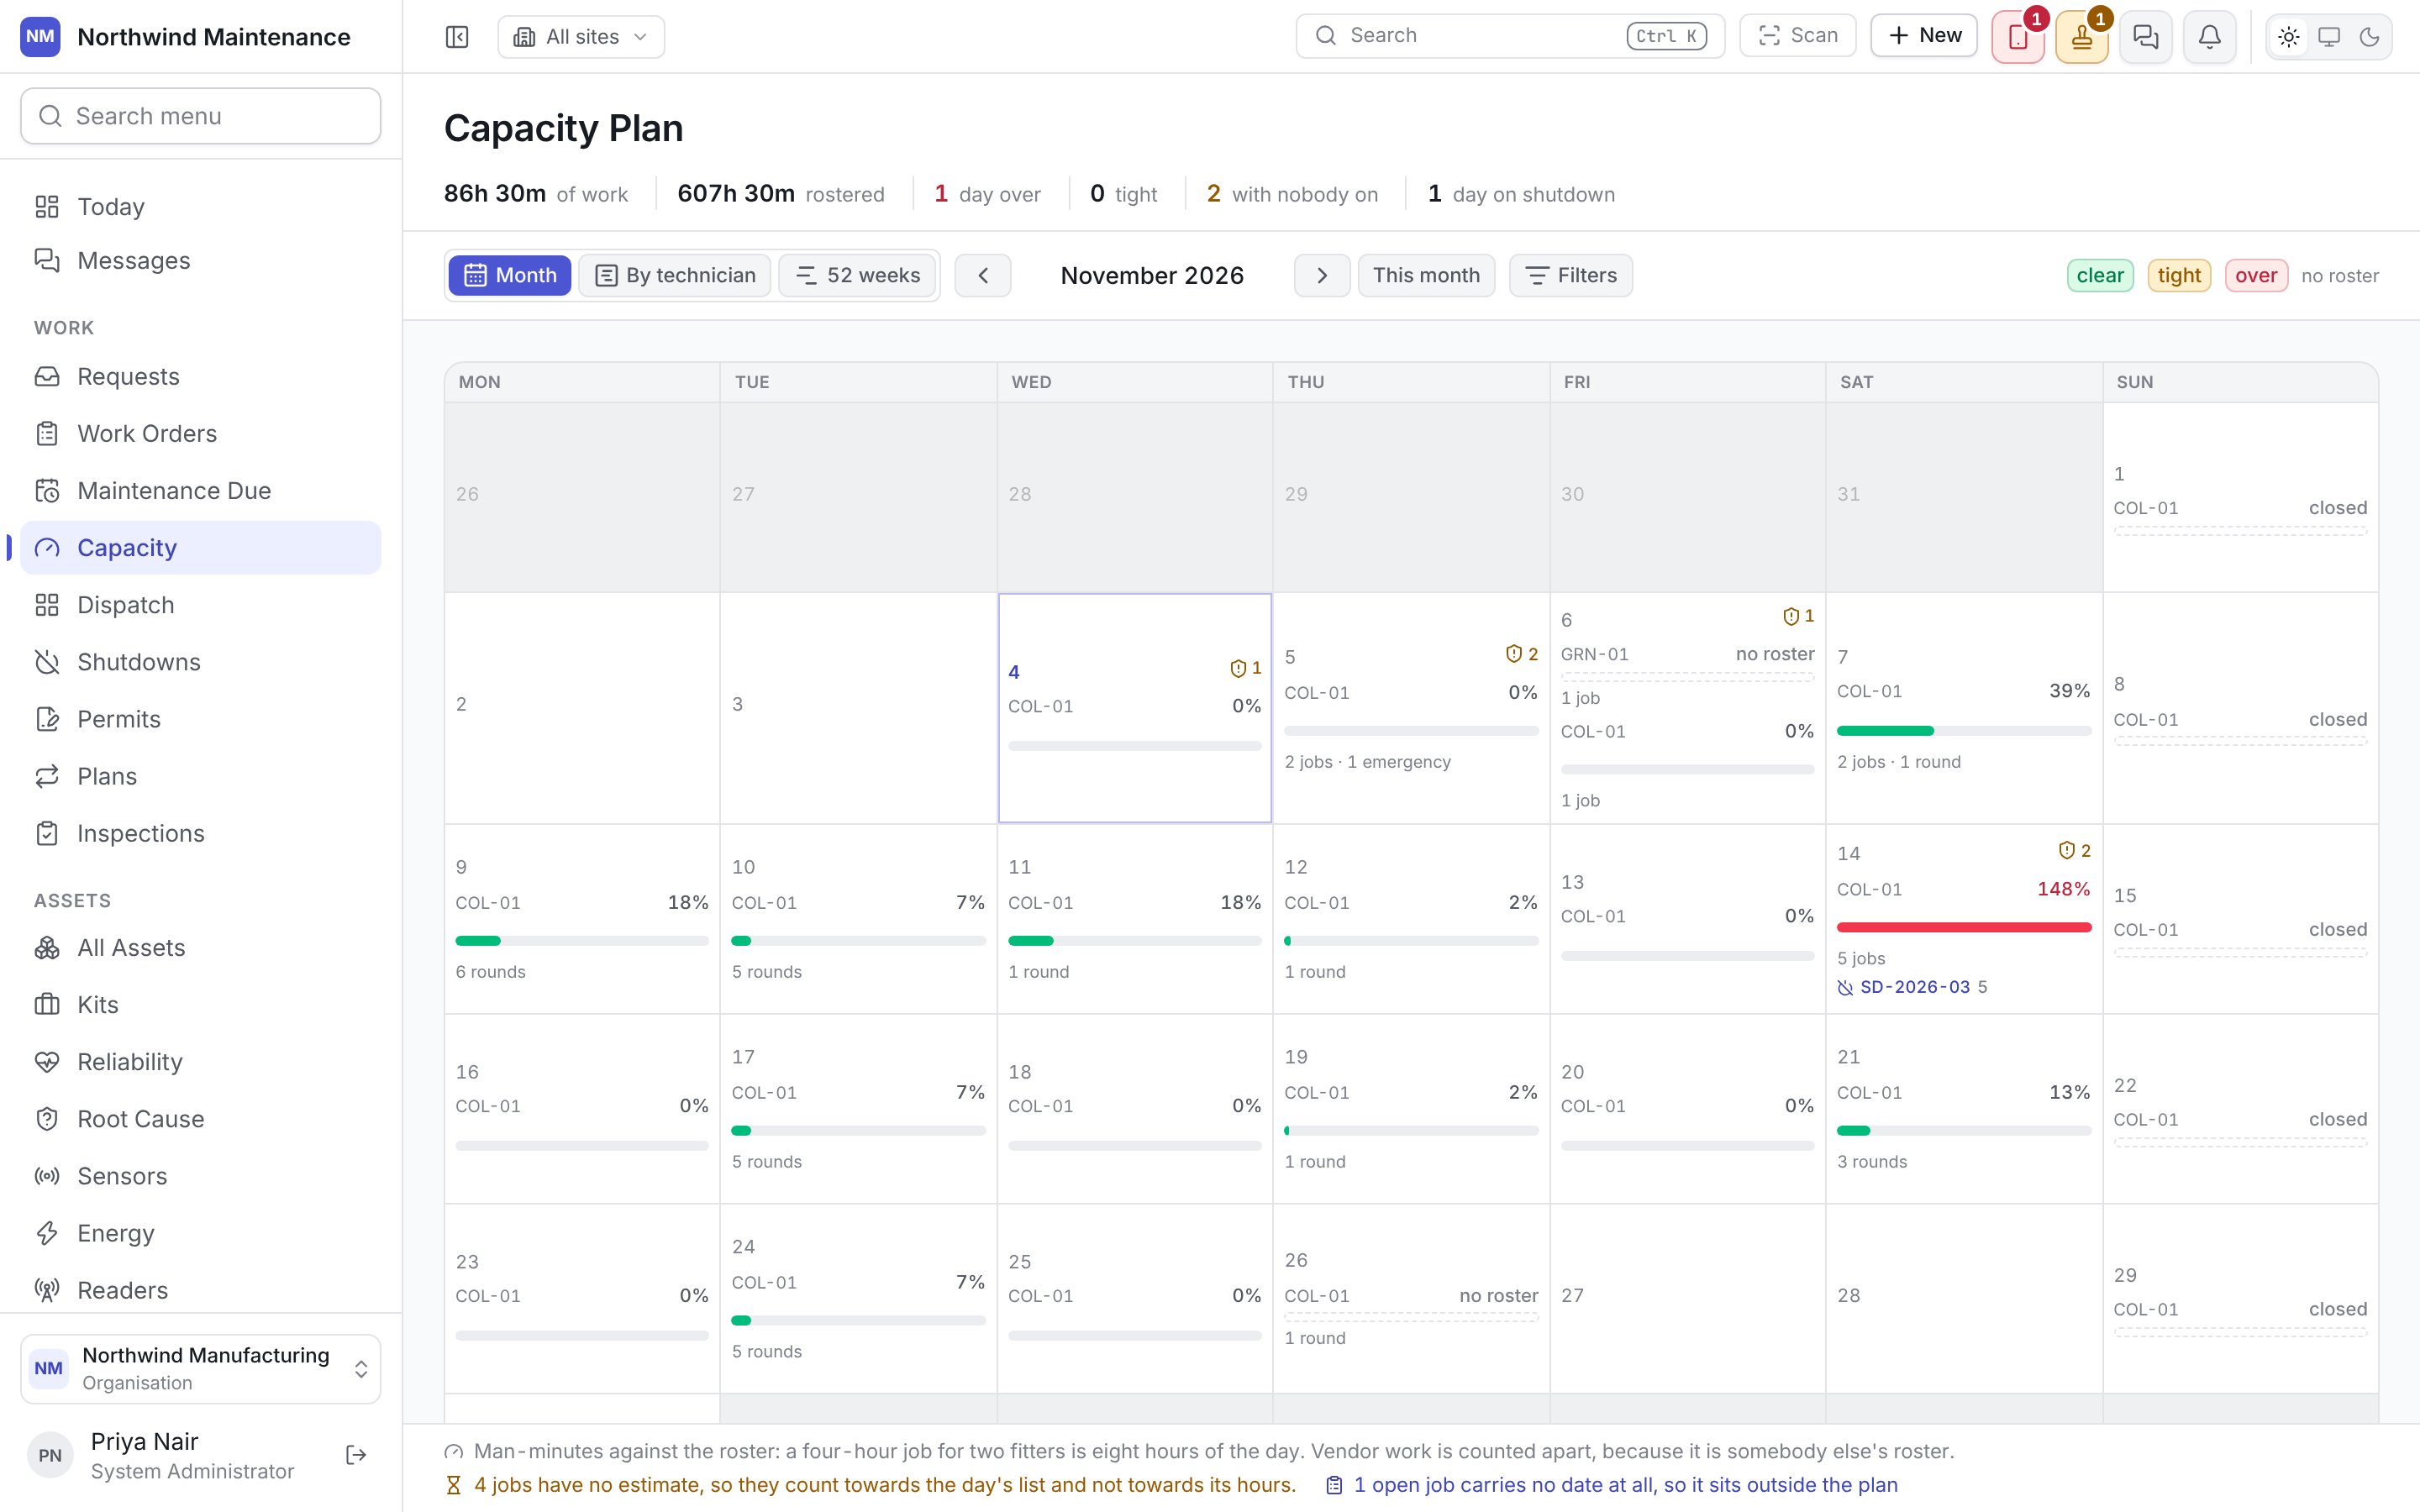
The default view: one calendar month, with Previous month, Next month and This month to move around it. The summary line for the month:
Each day shows one line per site, with how full the day is as a percentage and a bar:
Under the bar, the day lists how many jobs and rounds fall on it and flags emergencies. A warning badge with a count marks something outstanding on that day’s work — a part, a tool or a permit short. A shutdown on the day is shown by its code.
A single day
Click a day to see Capacity for that date:- What wants the day — each job and round with its hours, who has it (a person, a crew or a vendor) or not raised yet for a round that is not a work order yet, and what it costs the day.
- In the way — what is short: parts, tools and permits read from the same requirements as the job’s readiness, so a shortage here and a blocked job on the work order are one fact. A tool counts as a conflict when more work wants it on a day than there is of it. Jobs past their service level are flagged SLA breached.
- Who is on — each technician rostered that day, their shift, whether they are on call, the hours counted and the work Already named to them. “Nobody rostered” when no shift covers the day.
- When the site is on shutdown, the day says so.
Where the hours go
Below the calendar, a table breaks the month’s hours down By category or By asset: the hours, the share of the roster they take, the heaviest day (with how full it was), and how many jobs and rounds — including how many have no estimate, and how many hours fall on days nobody is rostered.By technician
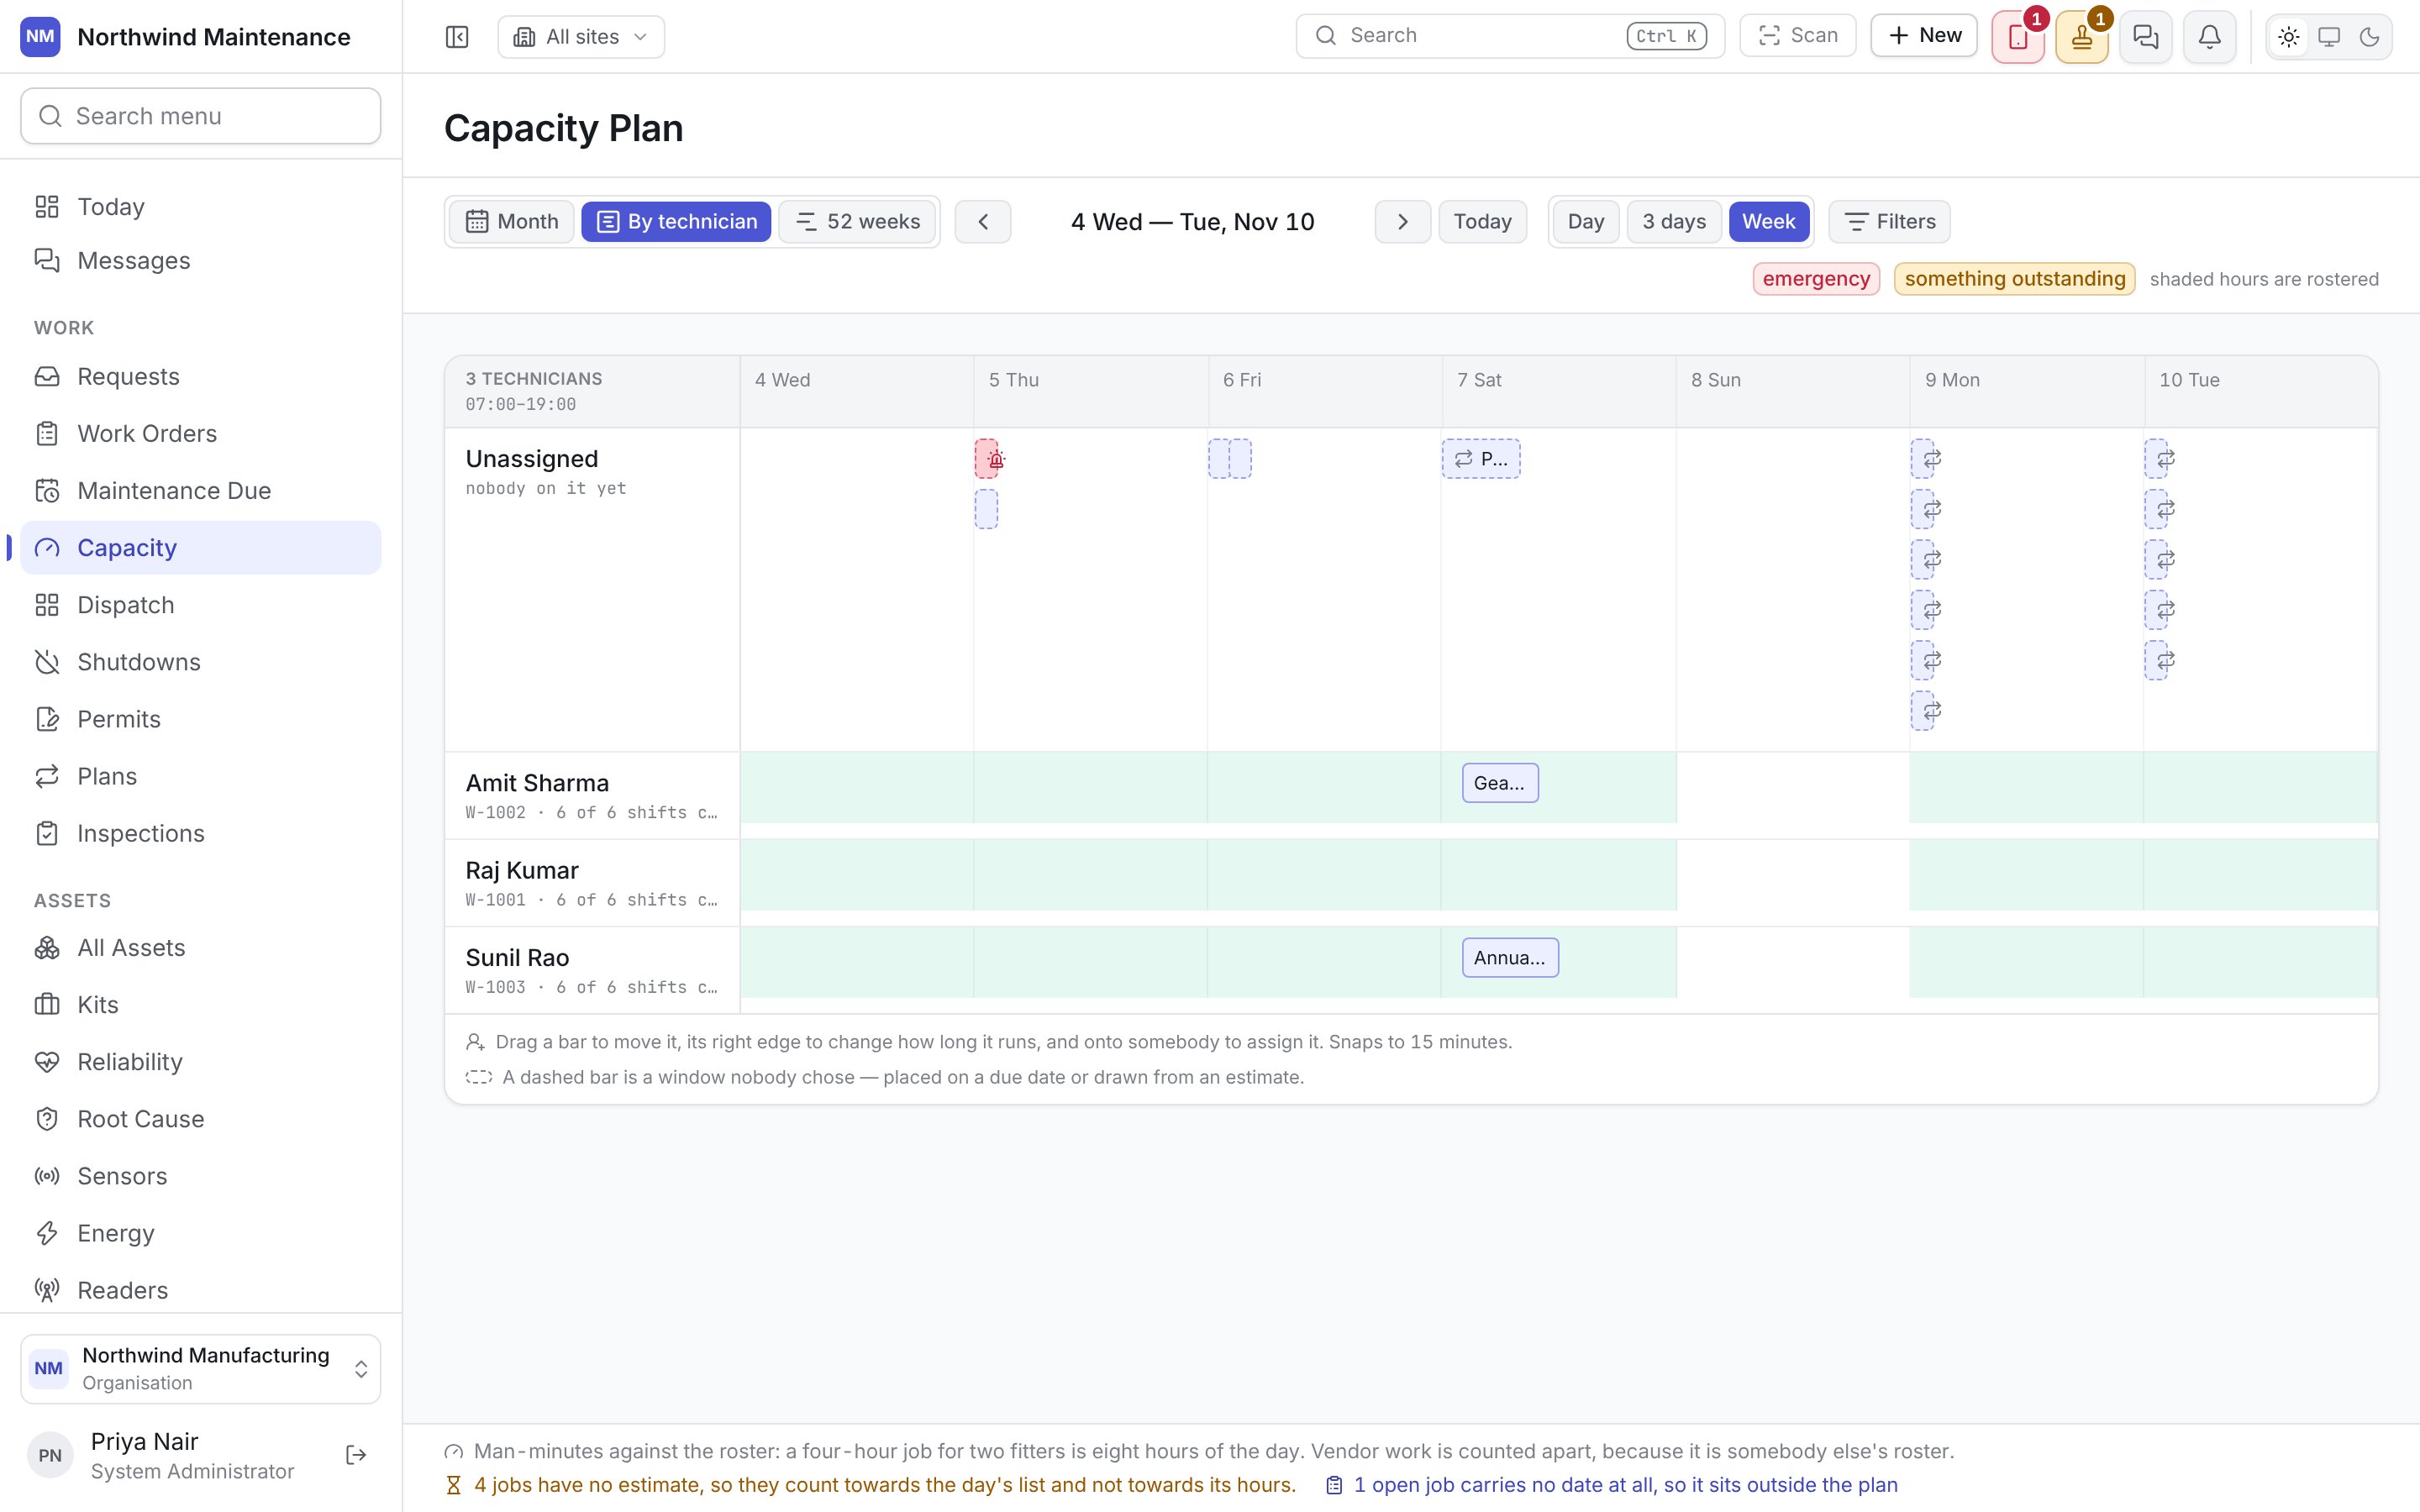
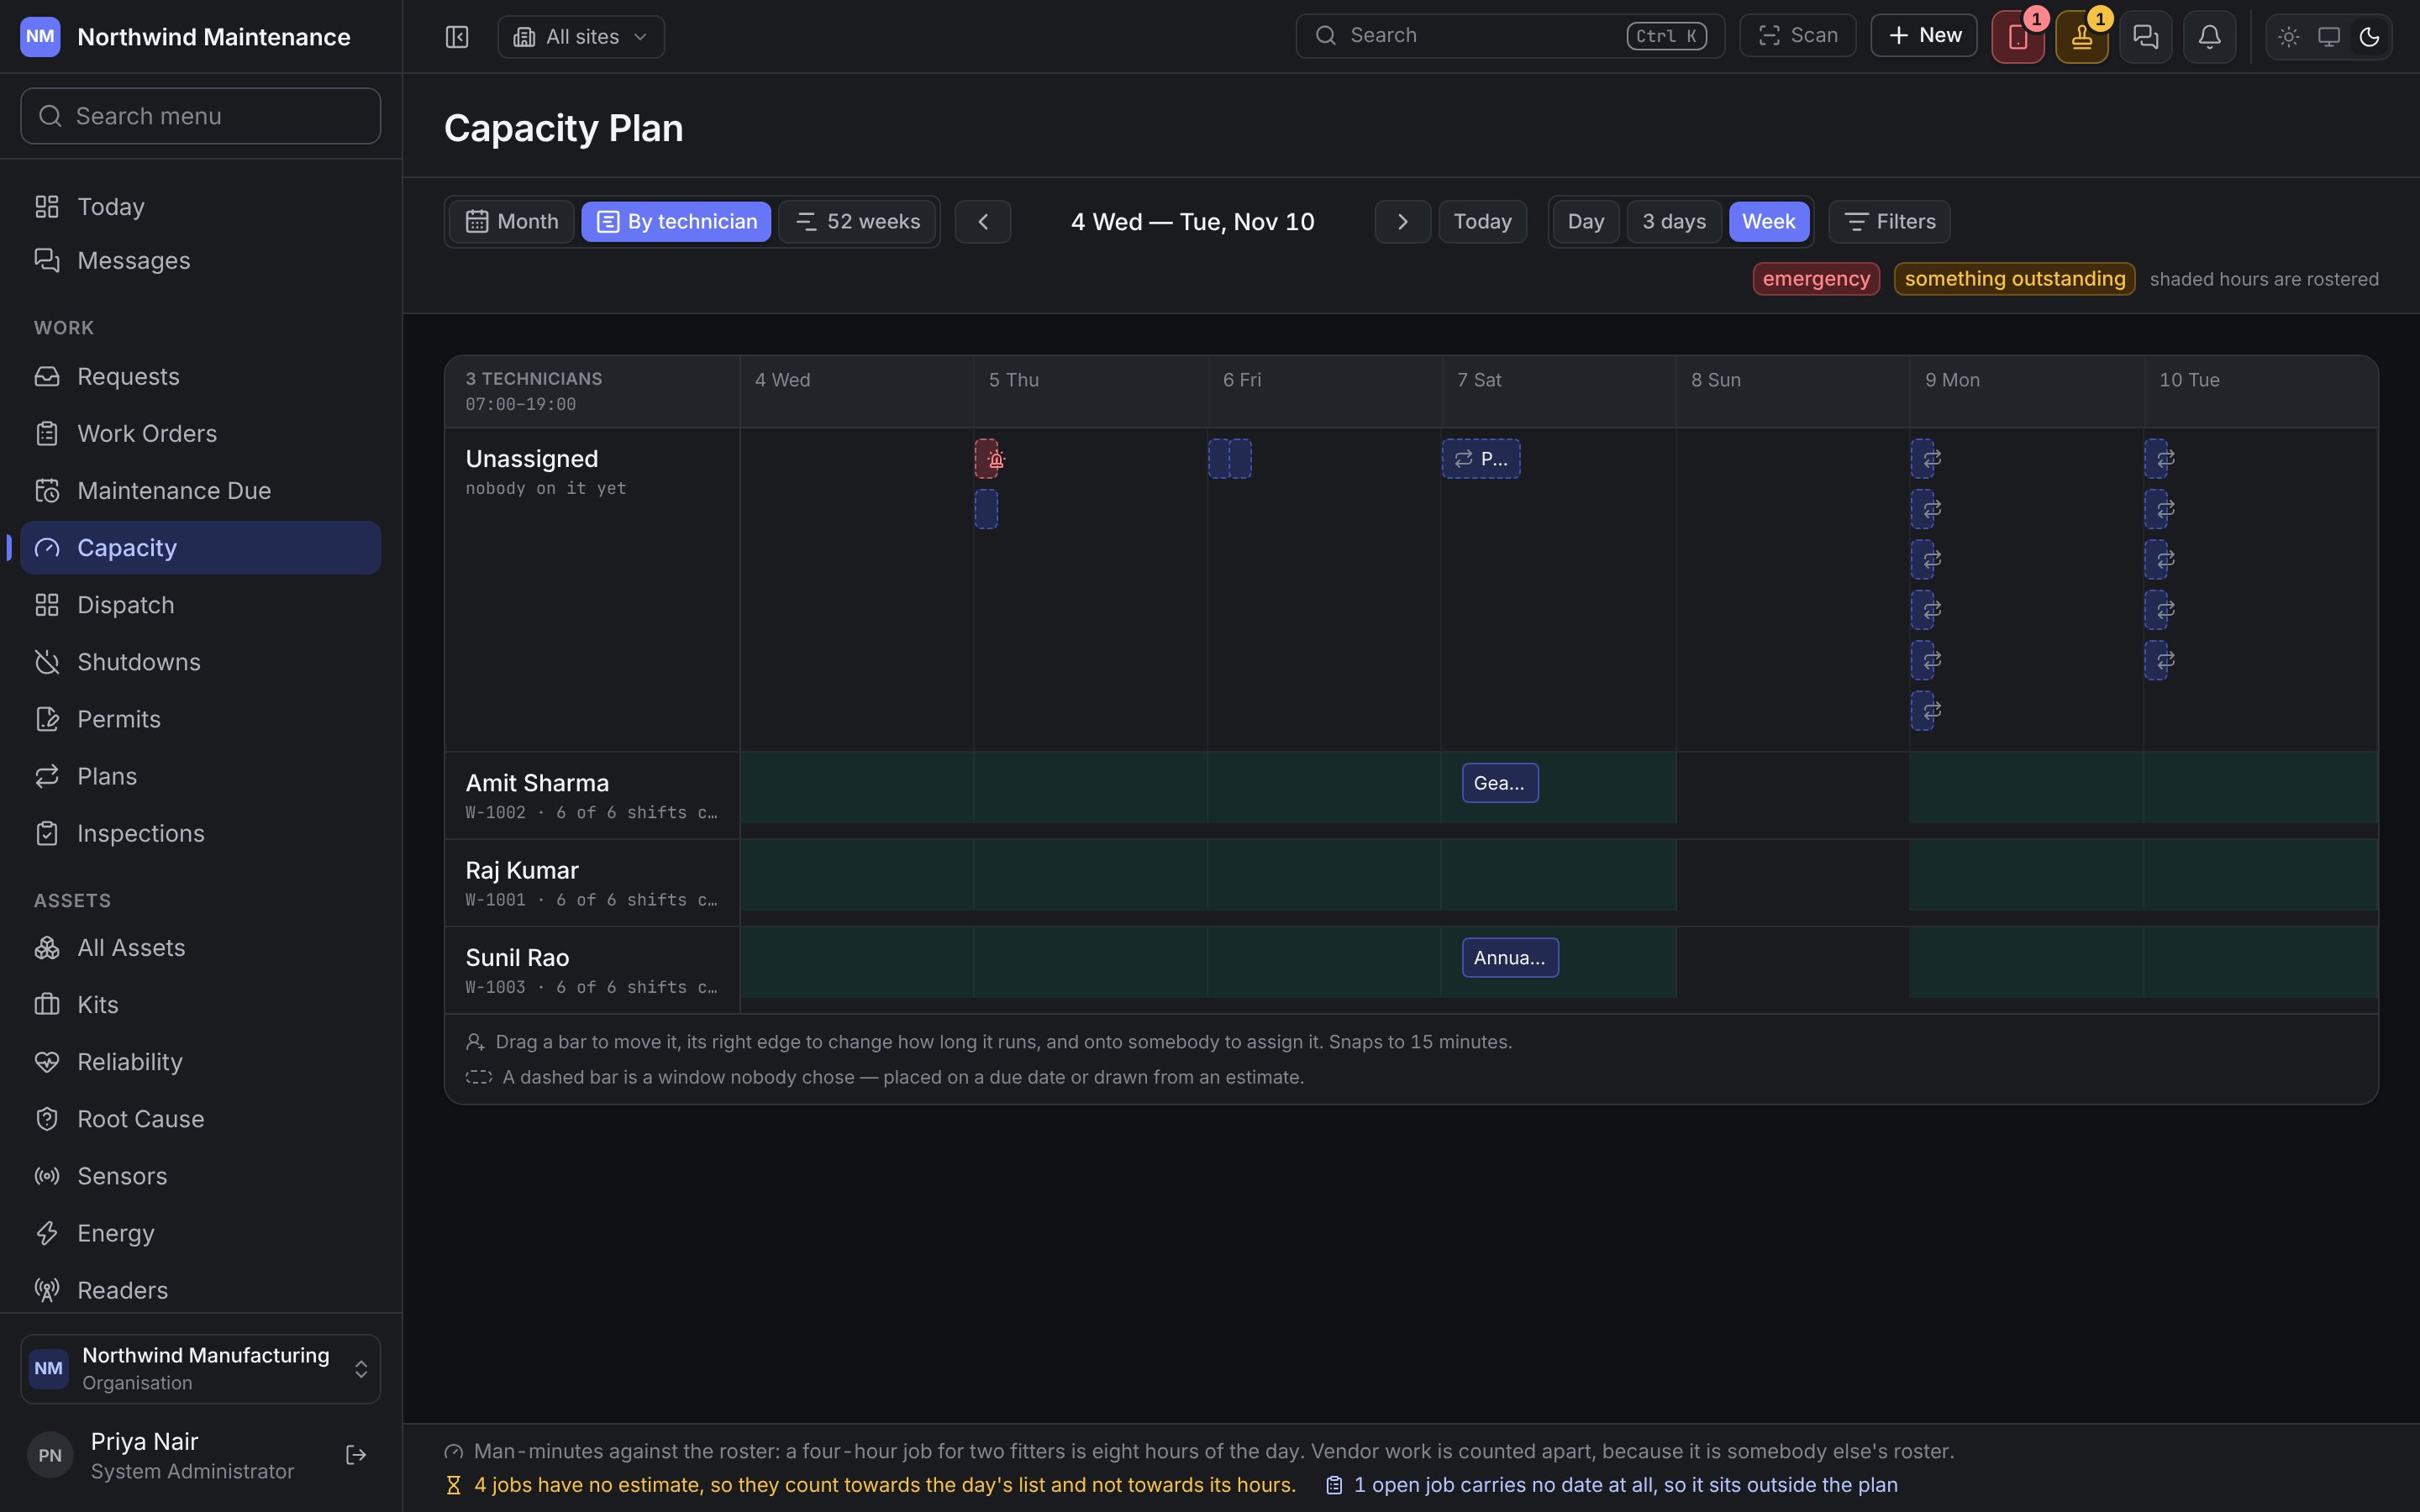
- drag a bar to move the job’s planned start,
- drag its right edge to change how long it runs,
- drag it onto somebody to assign it to them.
52 weeks
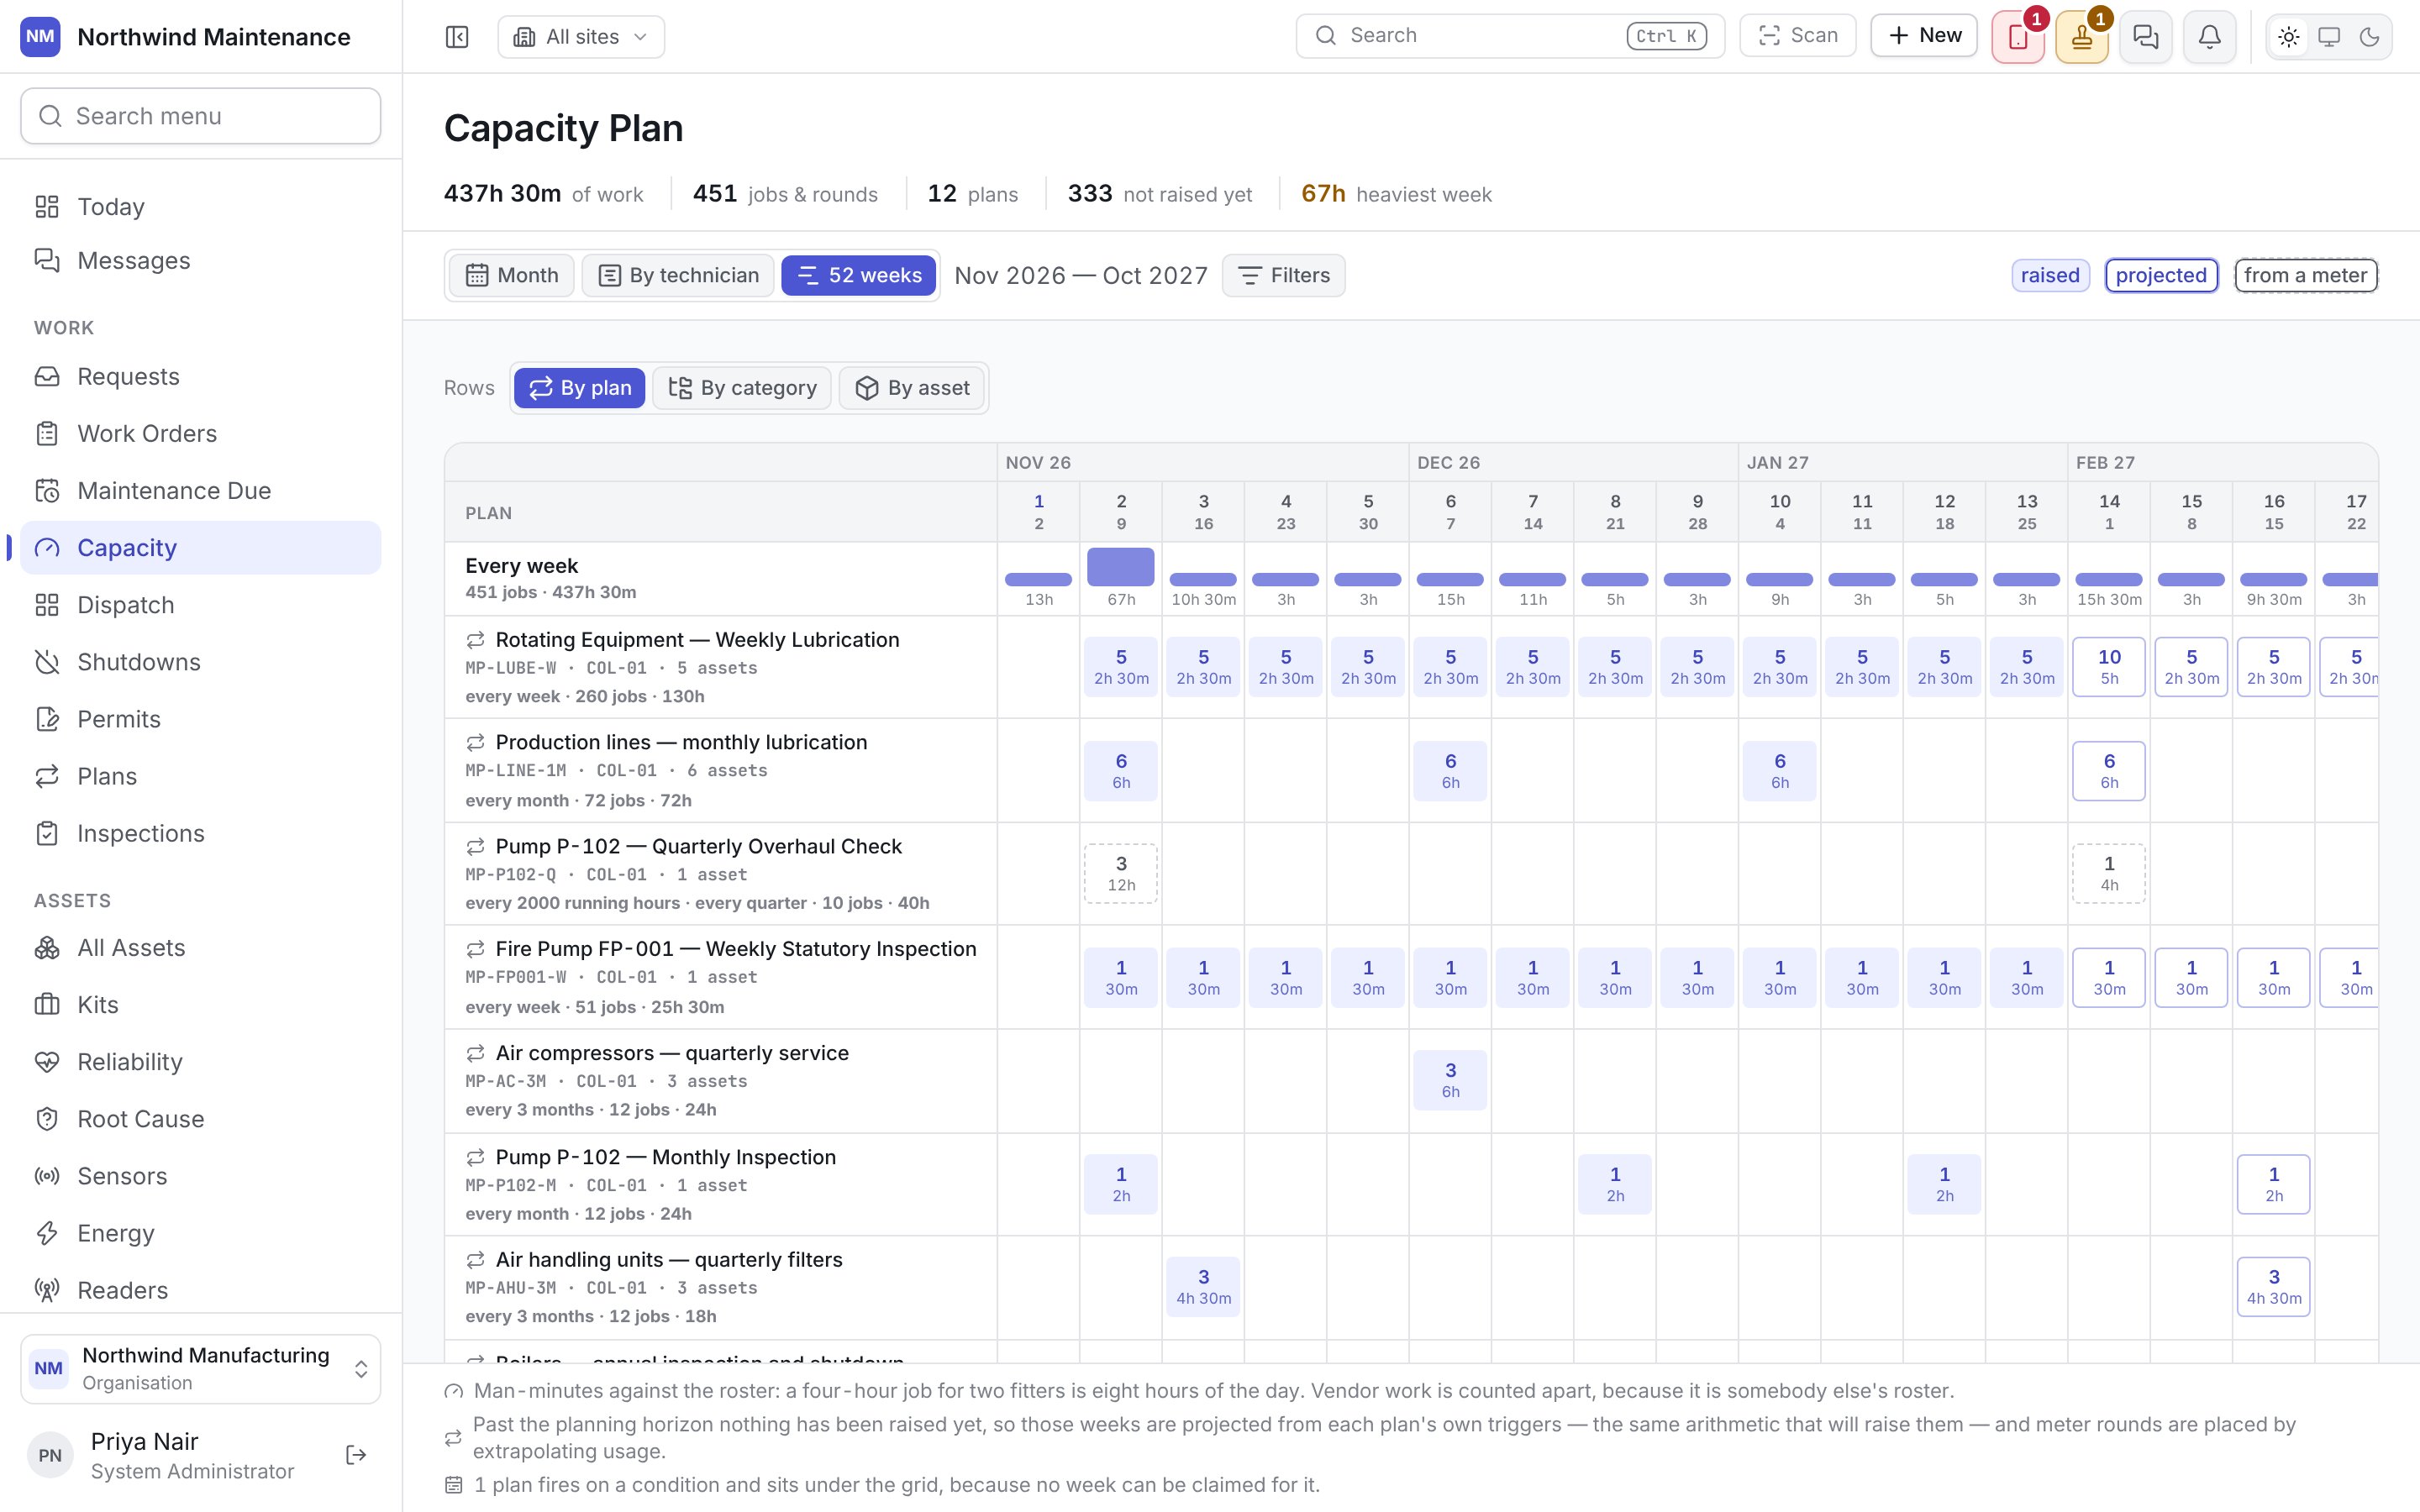
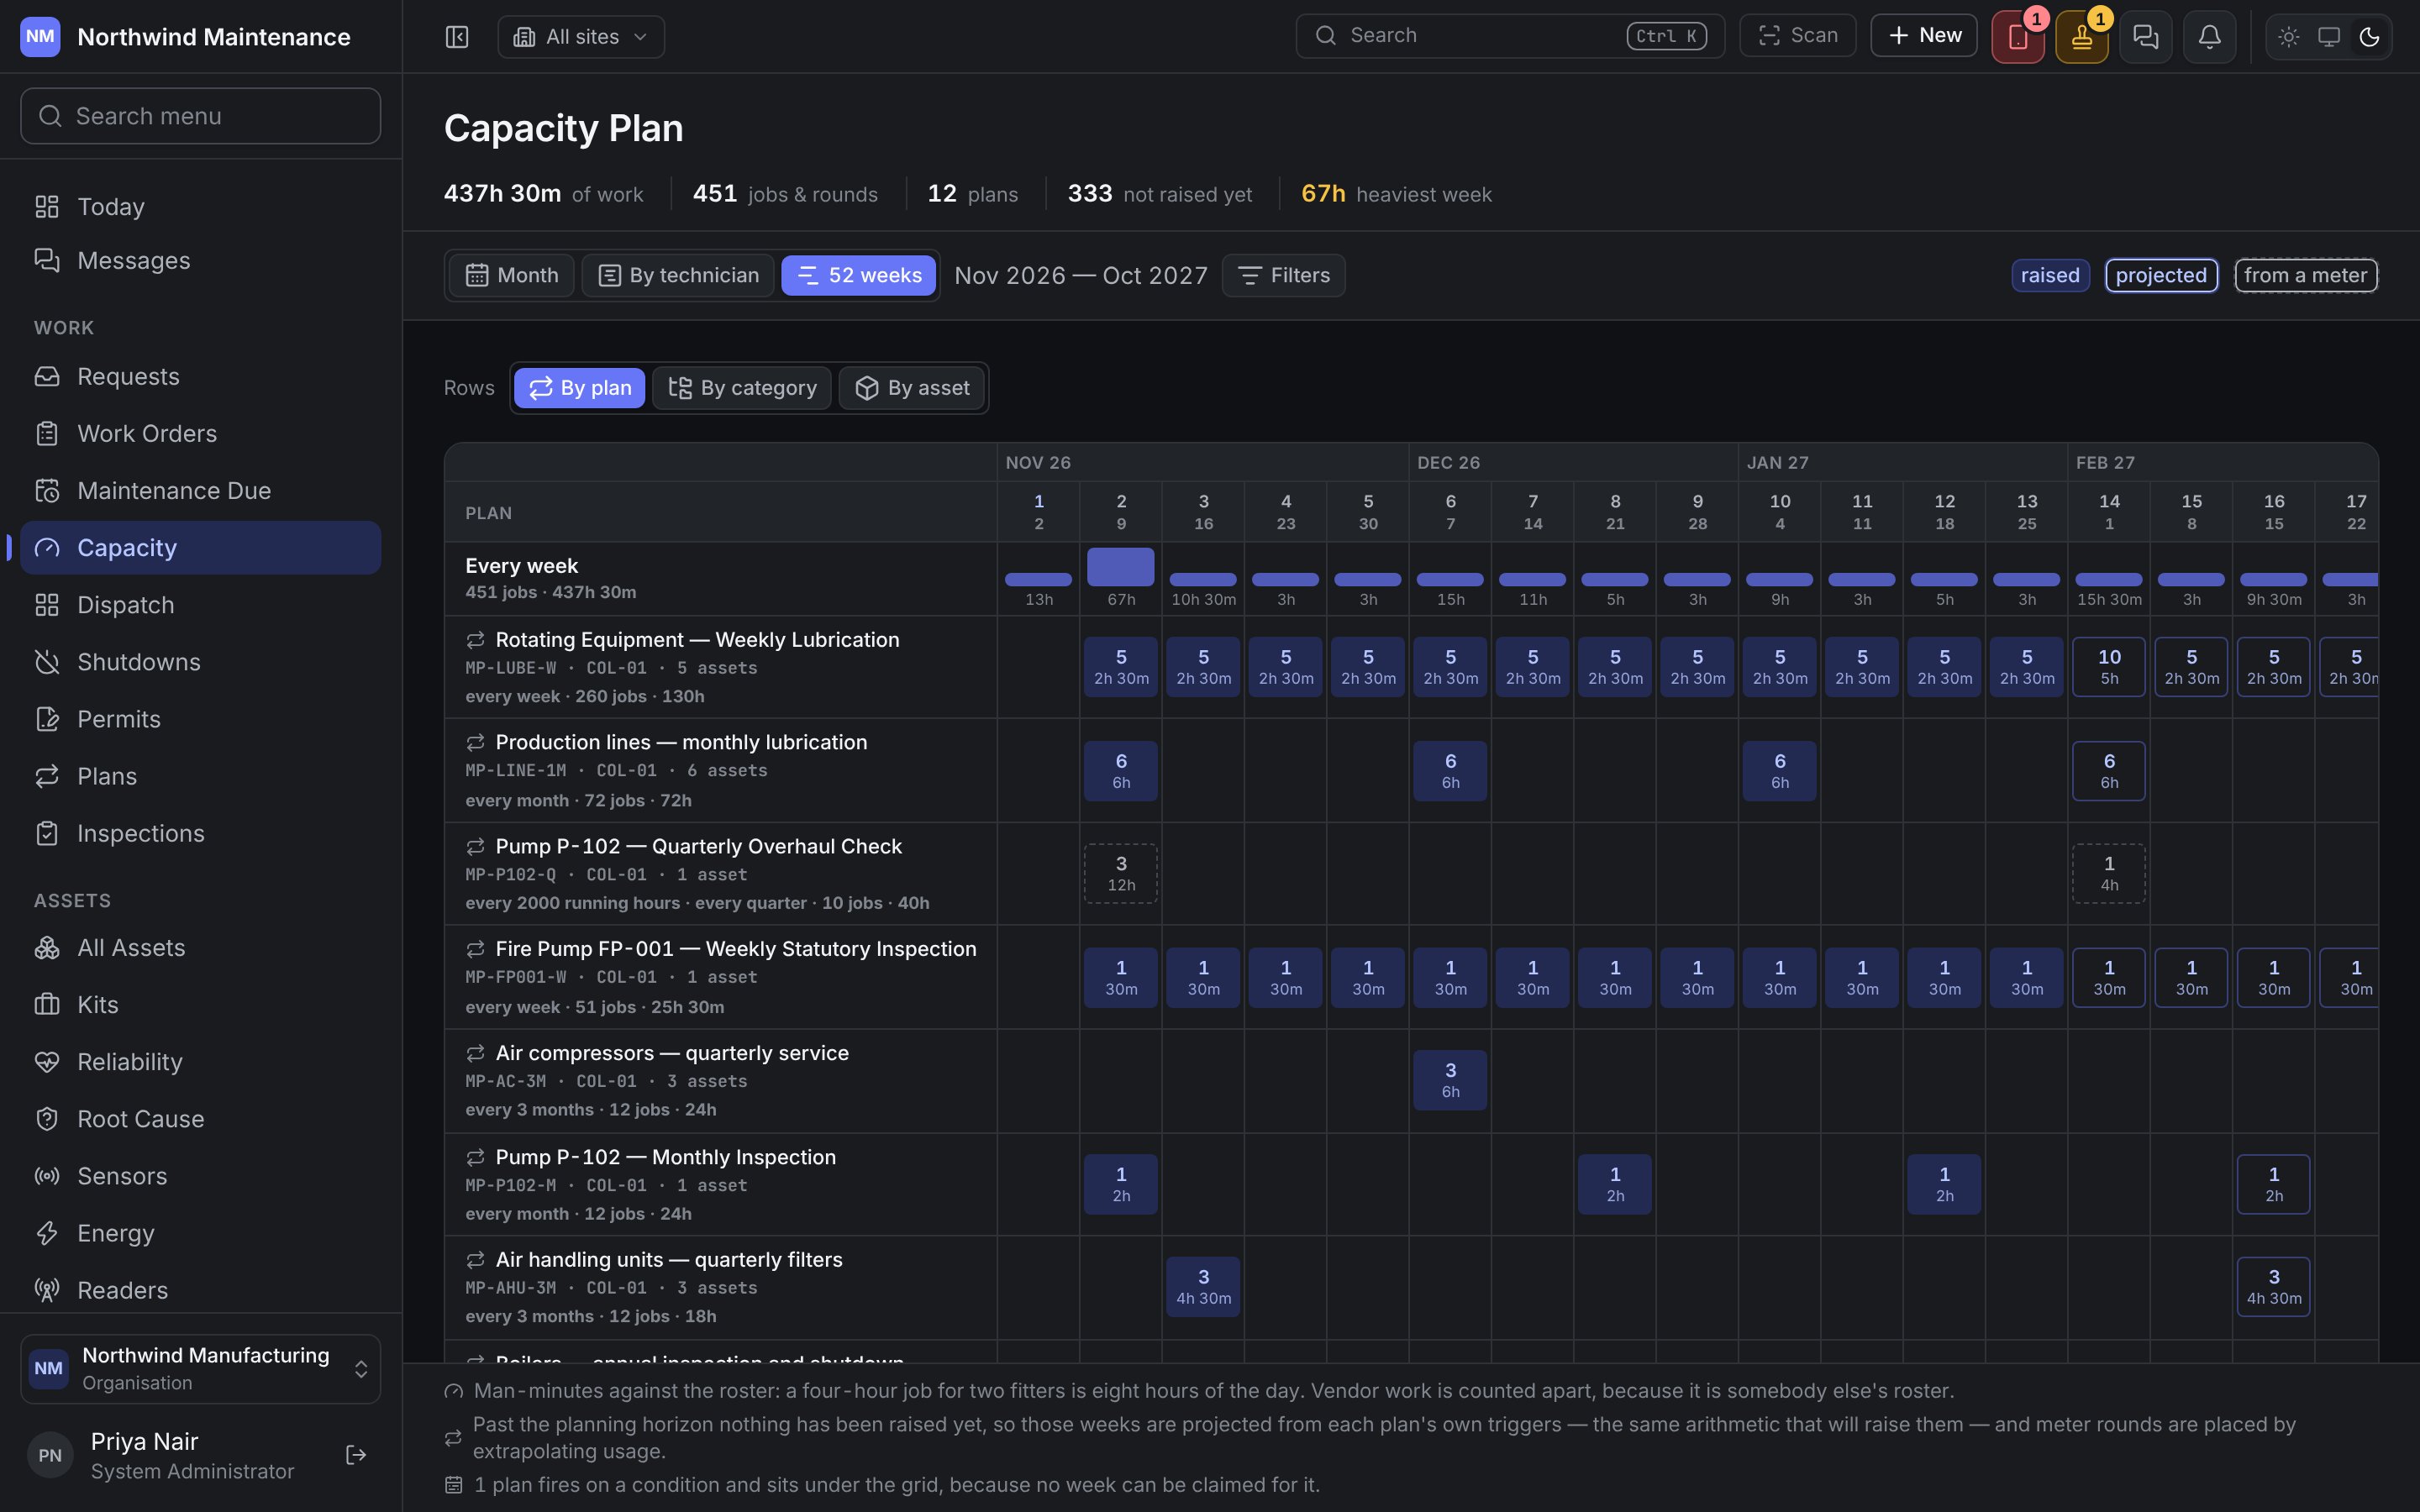
Condition-based plans have no fixed week to sit in, so they are listed below the grid with a note explaining why.
What to do about an overloaded day
Move a preventive round
Move a preventive round
Most plans carry a tolerance — a window either side of the due date within which the round still counts as on time. Moving a round inside that window costs nothing. Defer it from maintenance due, or see maintenance plans.
Bring work forward
Bring work forward
A clear day earlier in the week can take work off a full one, if the asset can be released. Drag the job on By technician, or Reschedule it on the work order.
Add hours
Add hours
Adjust shifts or add cover under workforce settings.
Send it out
Send it out
Work covered by a contract can go to the supplier instead. See contracts.