

If you don’t see this in your navigation, your administrator can switch the module on under Administration → Modules, or it may not be included in your plan.
Every figure is counted with your own access
This is the most important thing to understand about a dashboard, and the screen says it in the first line. Every widget on a board is counted with the access of the person looking at it — their site access, their asset scope and their permissions. Two people opening the same shared board can honestly see two different numbers, and neither of them is seeing anything they could not already open elsewhere in the product. The one exception is a board sent on a schedule. Nobody is reading it at the moment it is drawn, so it is counted with the owner’s access instead, and the emailed copy says whose. See Sending a board on a schedule.Who can do what
Permissions belong to roles, and roles are edited under Administration → Access — see
Roles. Only a board’s owner can arrange, share or delete it, whatever their
permissions; everybody else duplicates it.
The dashboards list
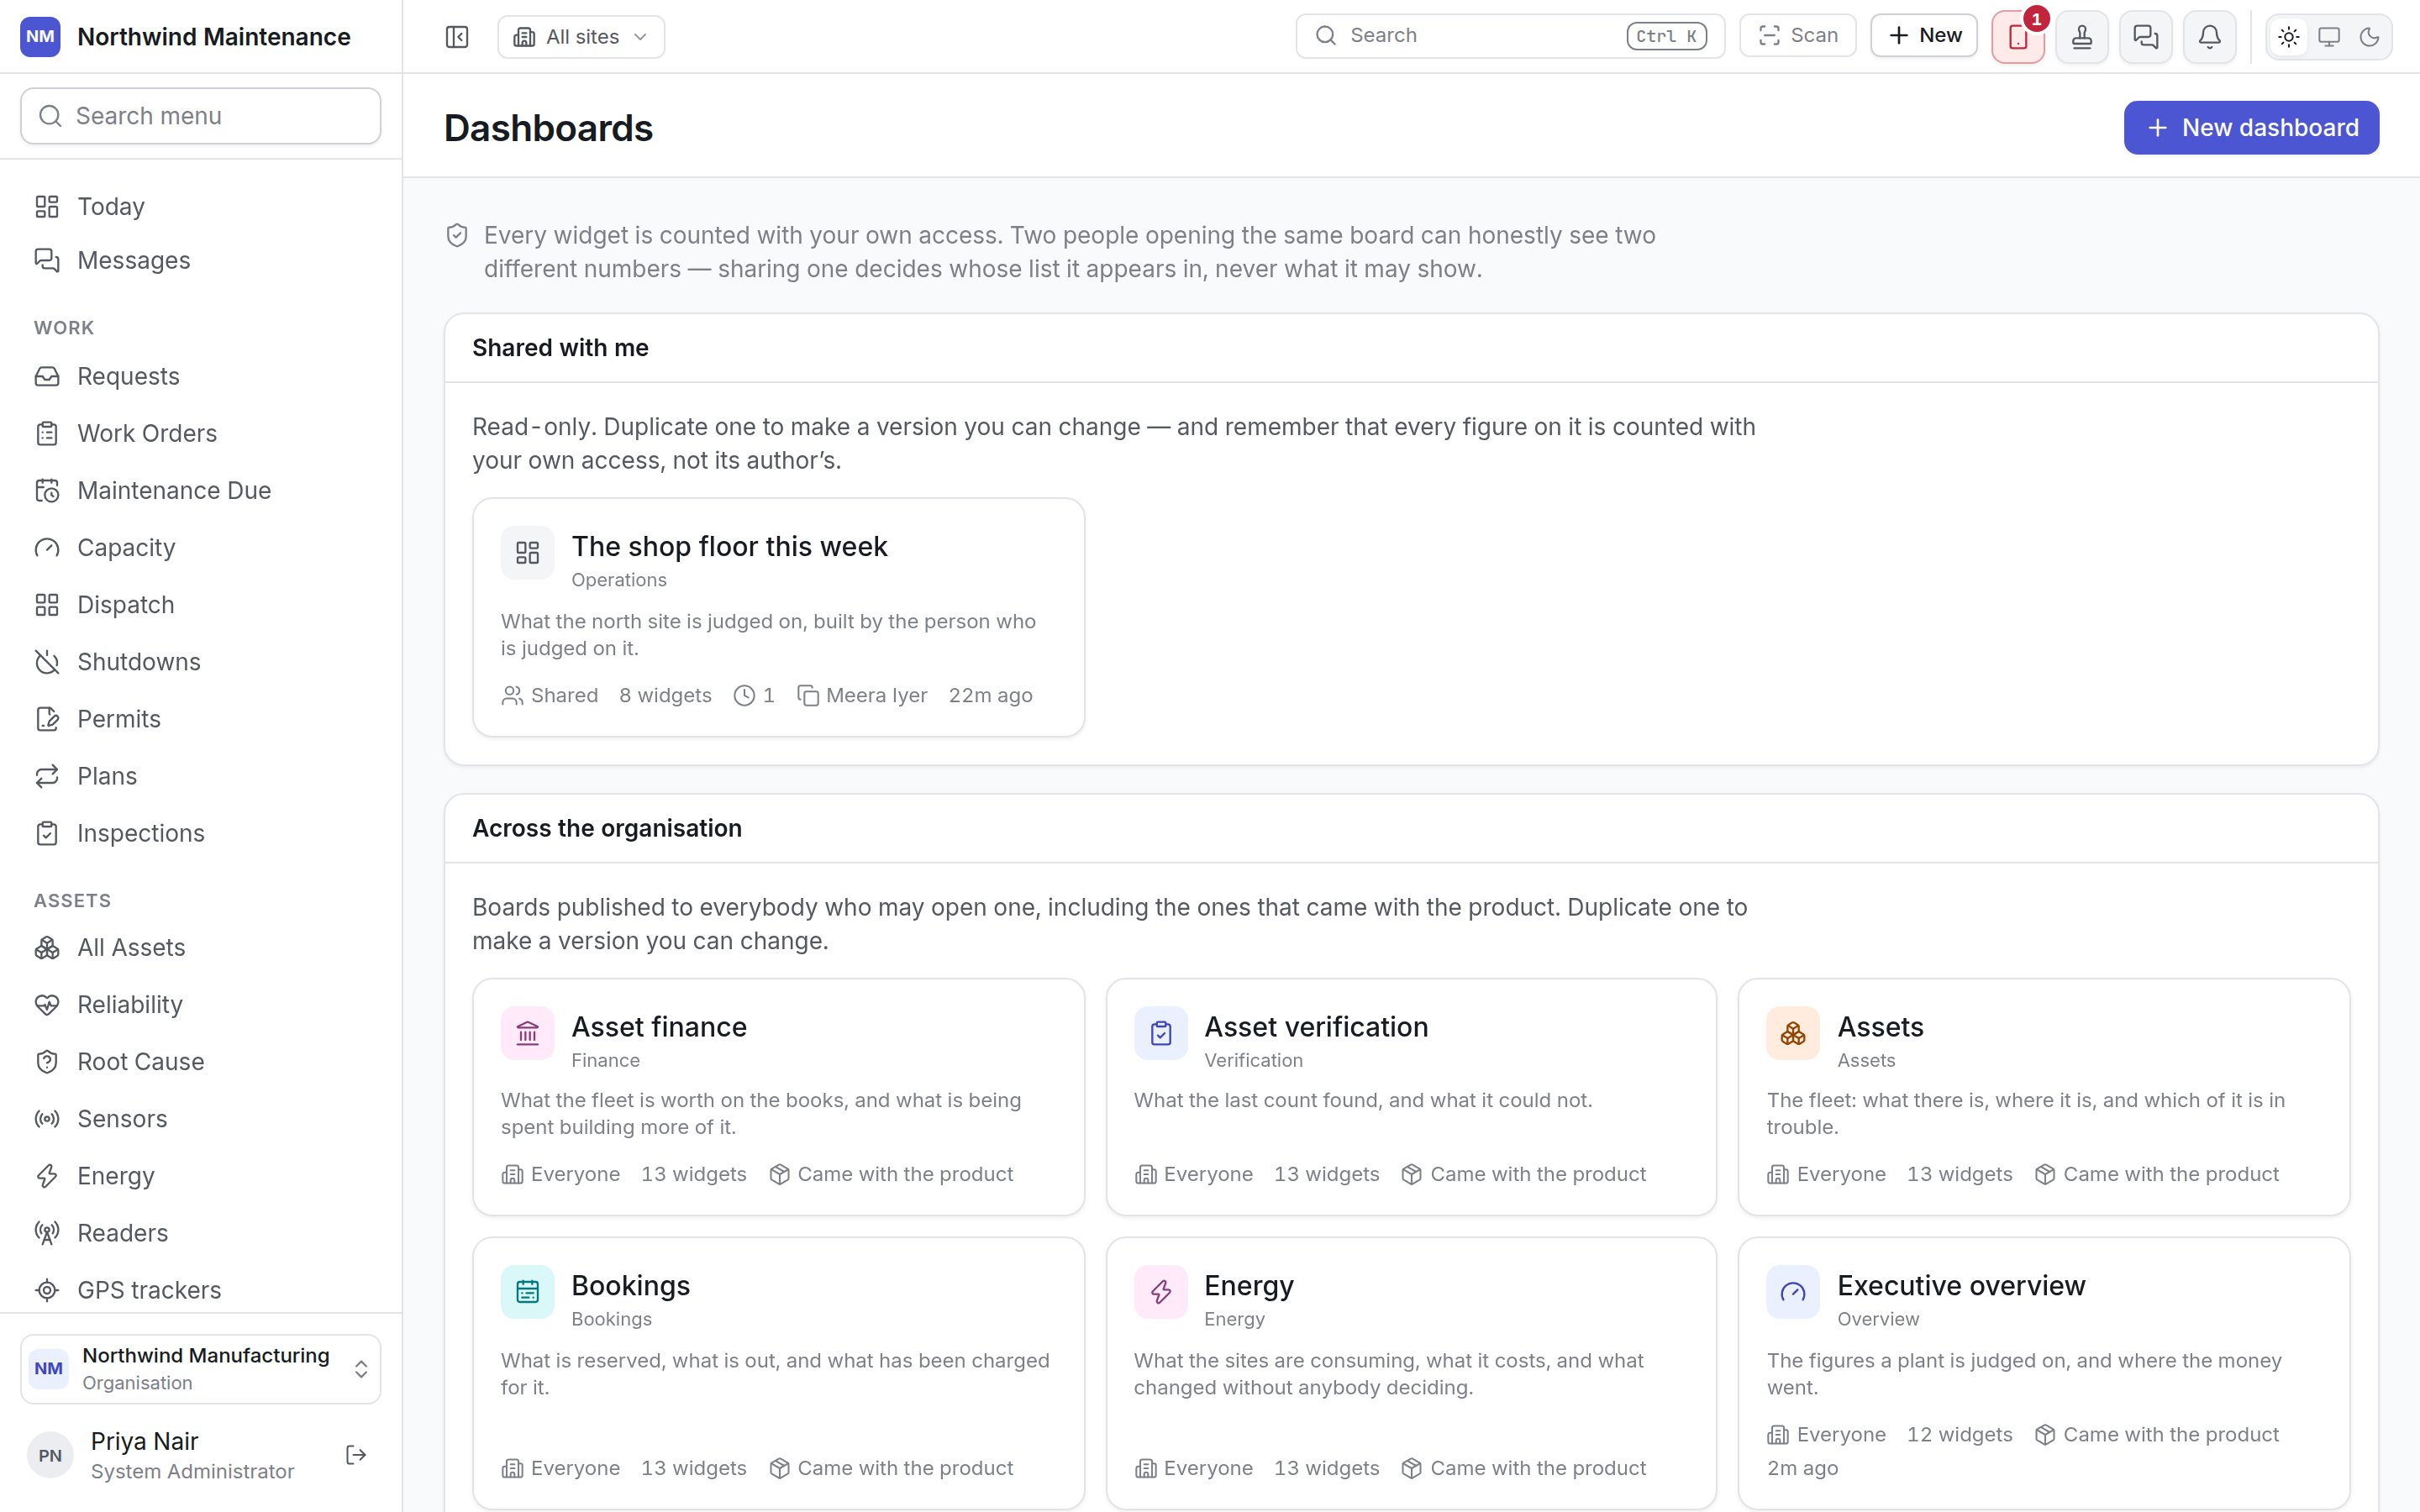
What a card shows
The boards that come with the product
A new organisation starts with a set of boards published to everybody, one per area: Asset finance, Asset verification, Assets, Bookings, Energy, Executive overview, Inventory, Lost and found, People and workload, Planned maintenance, Purchasing, Reliability, Sensors, Tools, Vendors and contracts and Work orders. Each holds twelve or thirteen widgets. They cannot be rearranged in place; duplicate one to make a version you can change.Creating a dashboard
New dashboard (top right) needs permission to create dashboards. It asks for one thing.
Create makes the board and opens it. It starts private and empty — “Add widgets, then
decide who it is for.” Nobody else can see that it exists until you share it.
The other way to start is Duplicate on any board you can open. The copy is yours, private, and
opens straight away, with every widget of the original. This is how you change a board somebody
else owns, including the ones that came with the product.
Reading a board
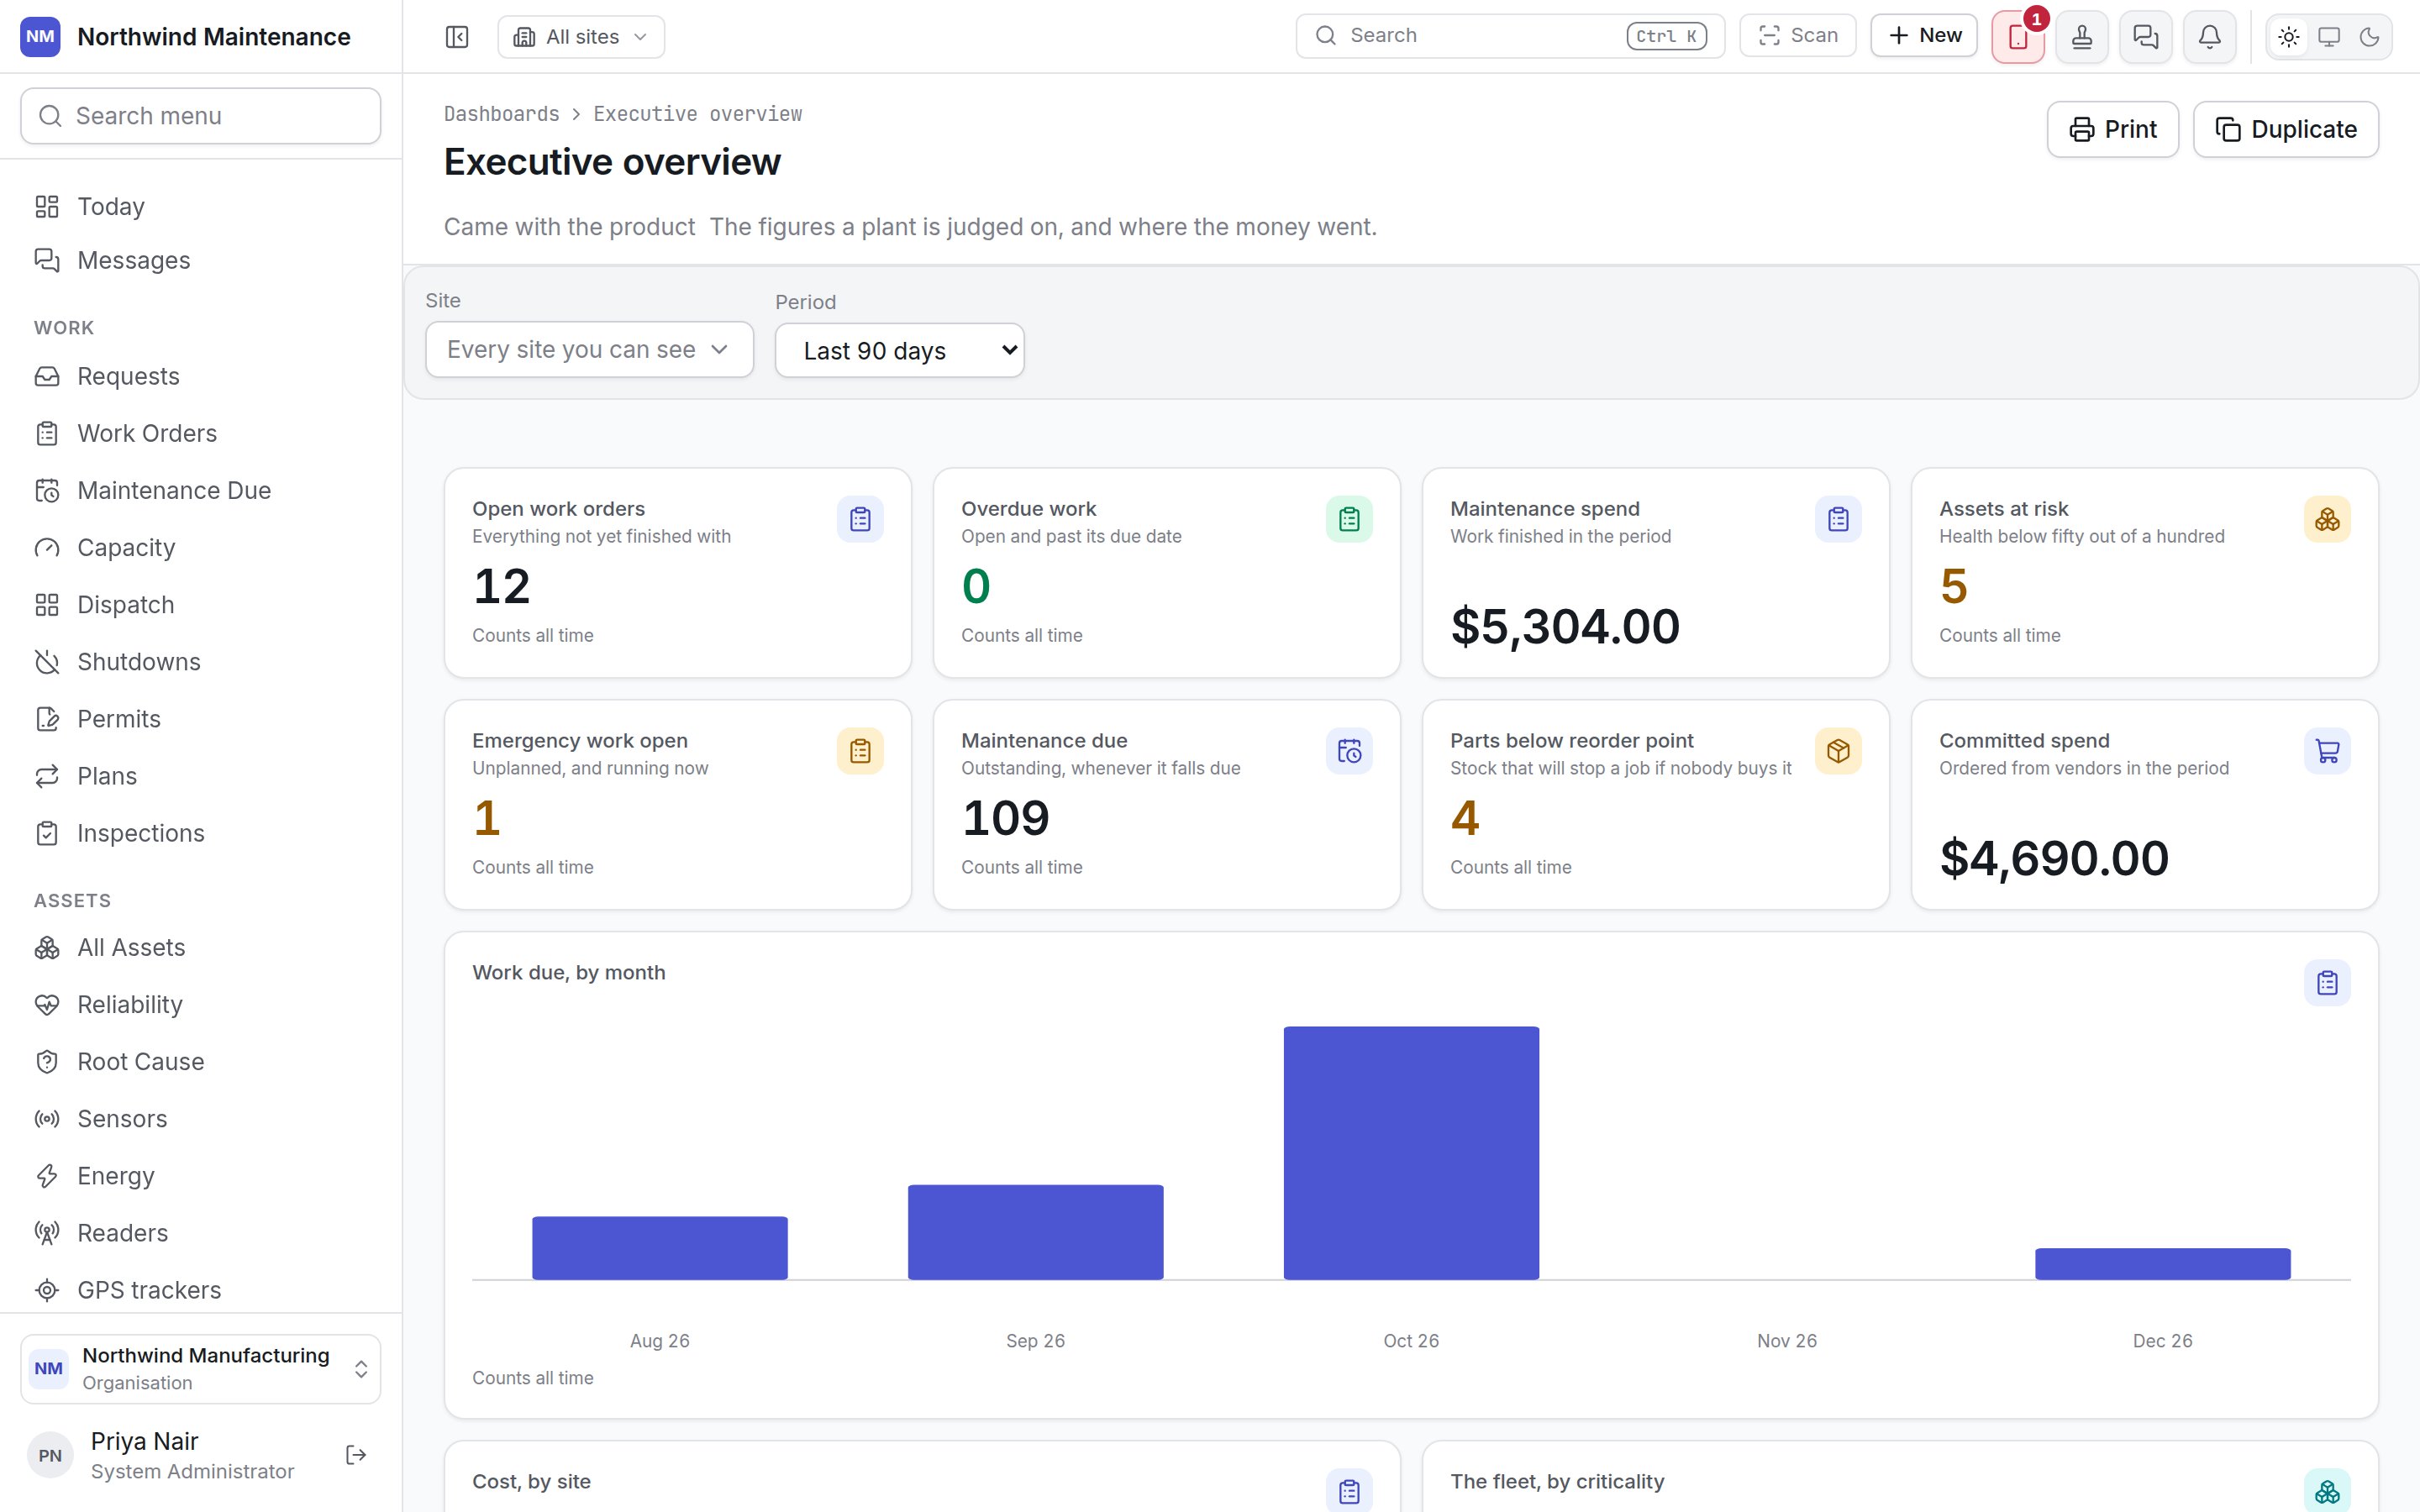
The filter bar: site and period
Above the tiles sit two controls.
Your selection is for this visit only. It never changes the board itself, and it never changes what a
schedule sends.
The filter bar is a promise each widget has to opt into. A widget only follows the site and the
period through columns its author named for them (see What the board’s filter
reaches). A widget the selection does not reach says so on its own
face, in small text under the figure:
- Counts all time — you chose a period, and this widget is not filtered by period.
- Counts every site — you chose a site, and this widget is not filtered by site.
Seeing the rows behind a figure
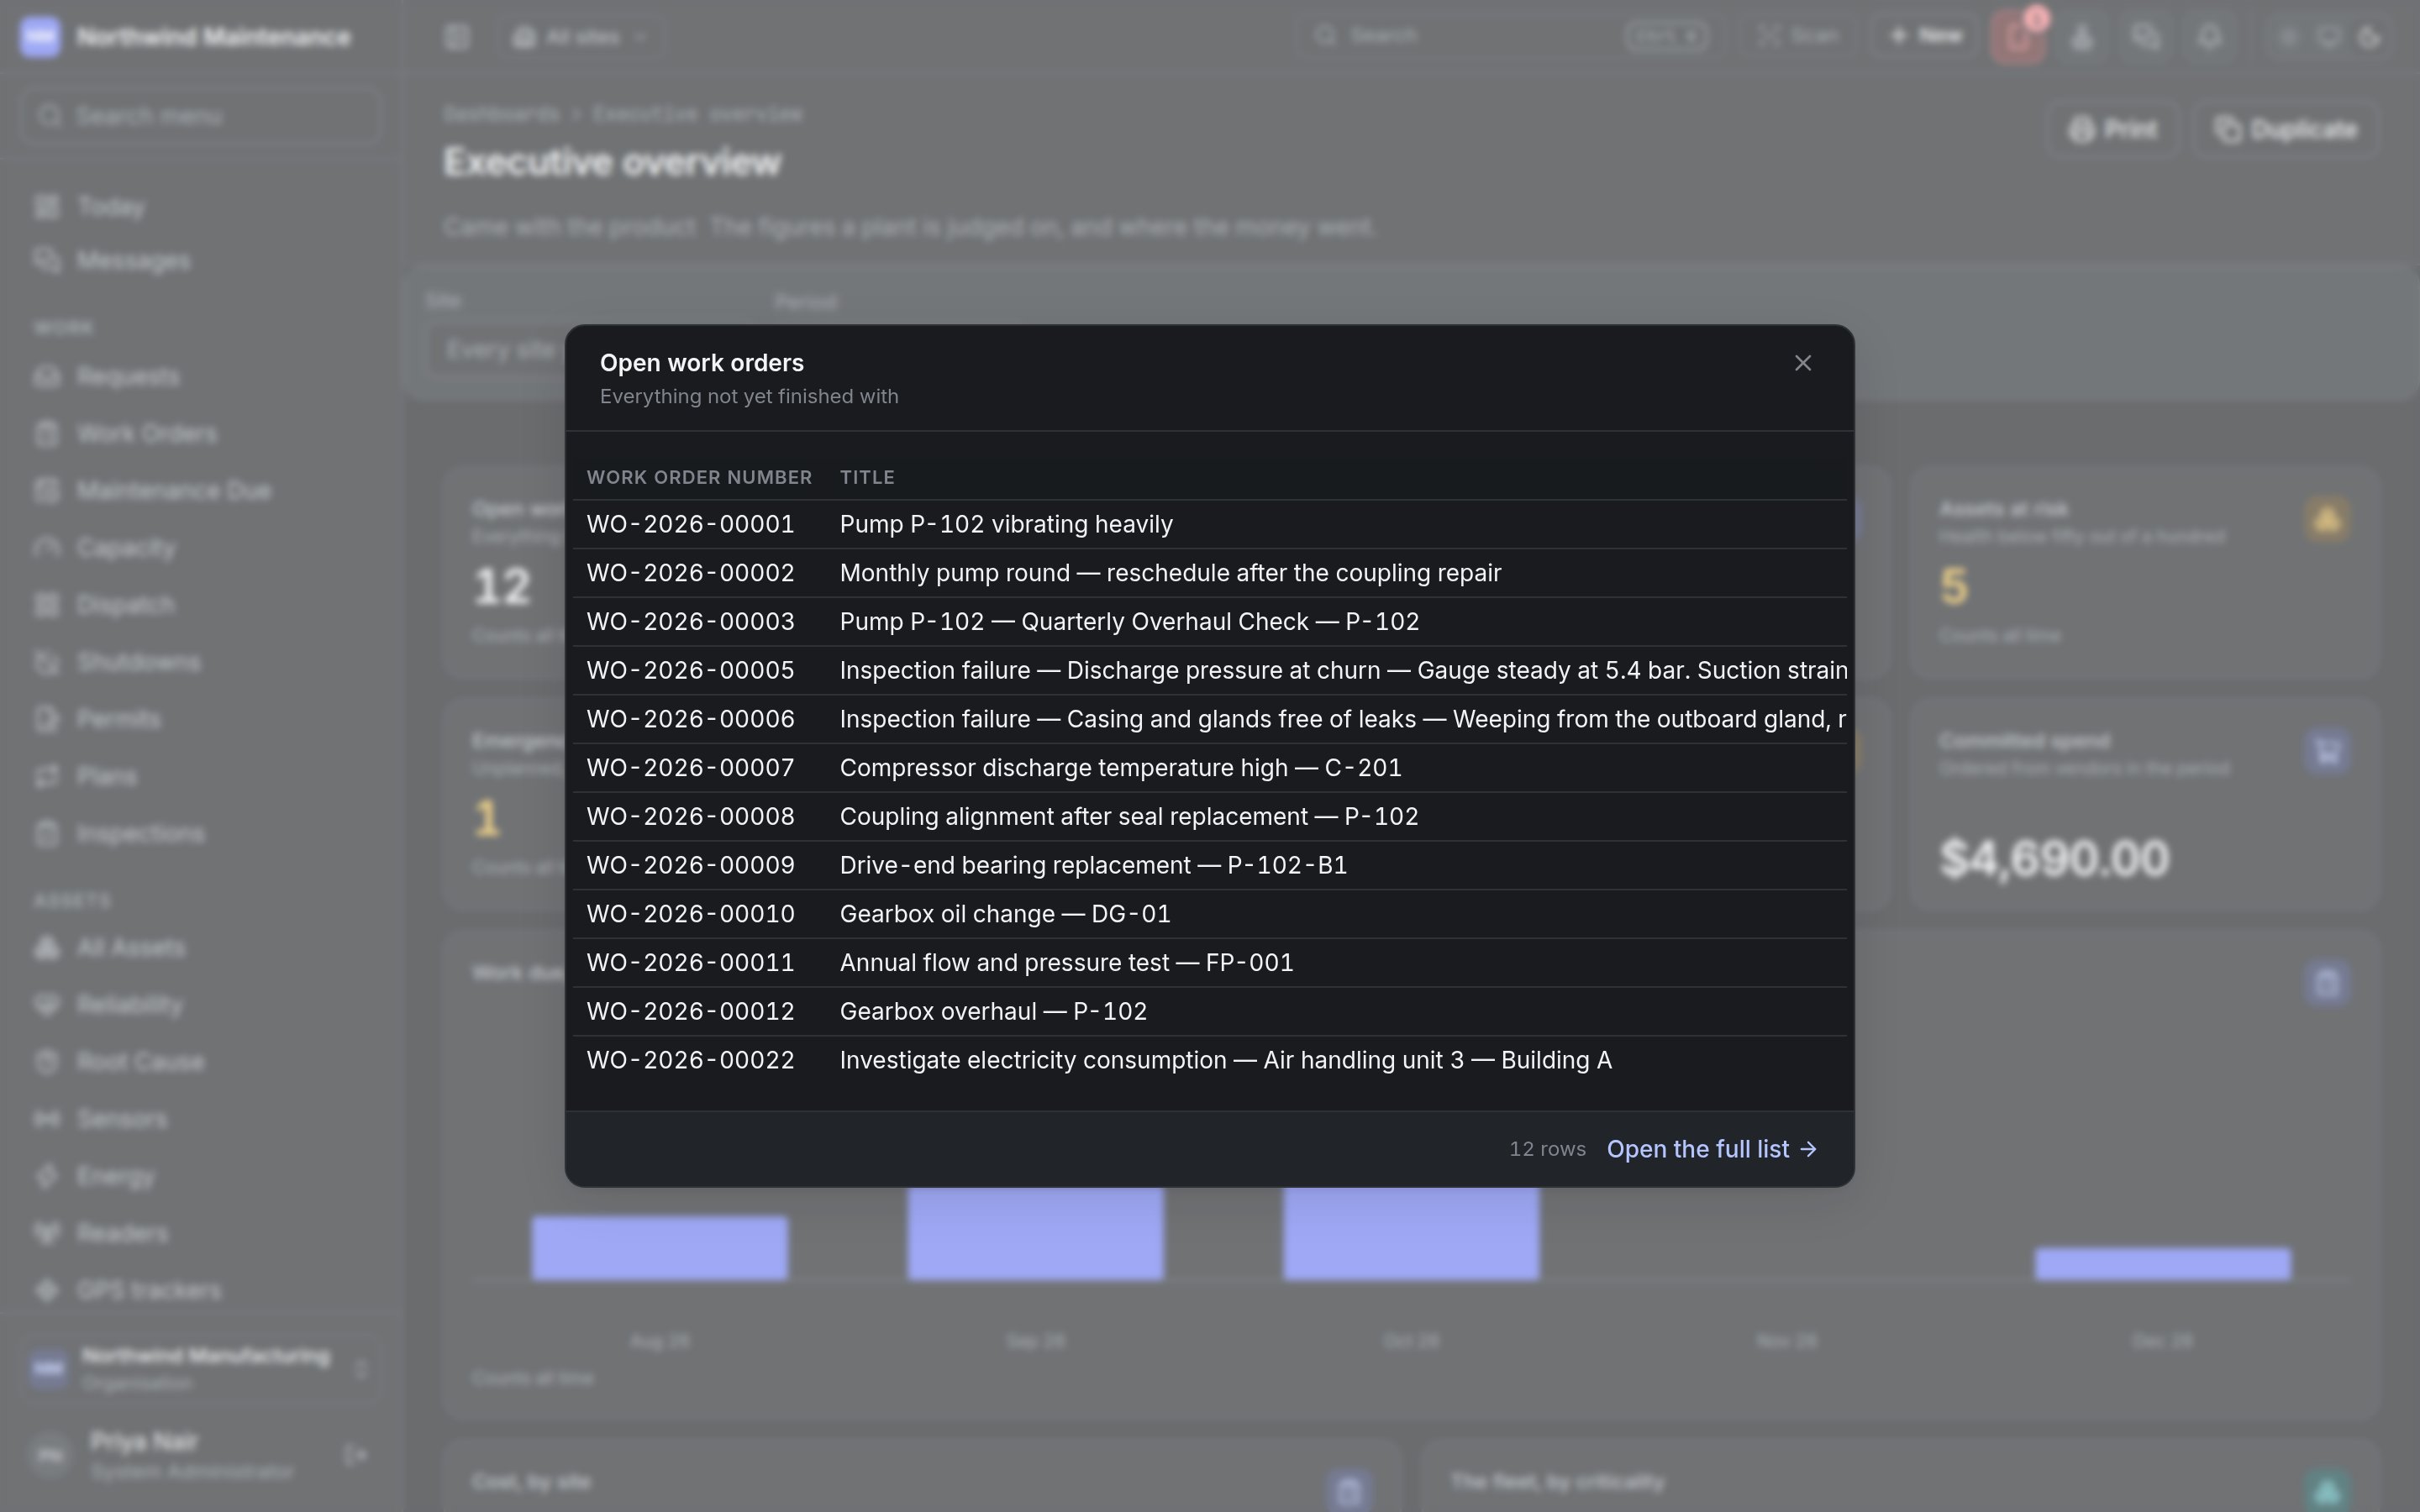
Click a tile or a bar and a window opens on the rows behind it — the records that make up that number, as you are allowed to see them. A long list shows The first n rows; Open the full list, where it is offered, takes you to the register the figure came from.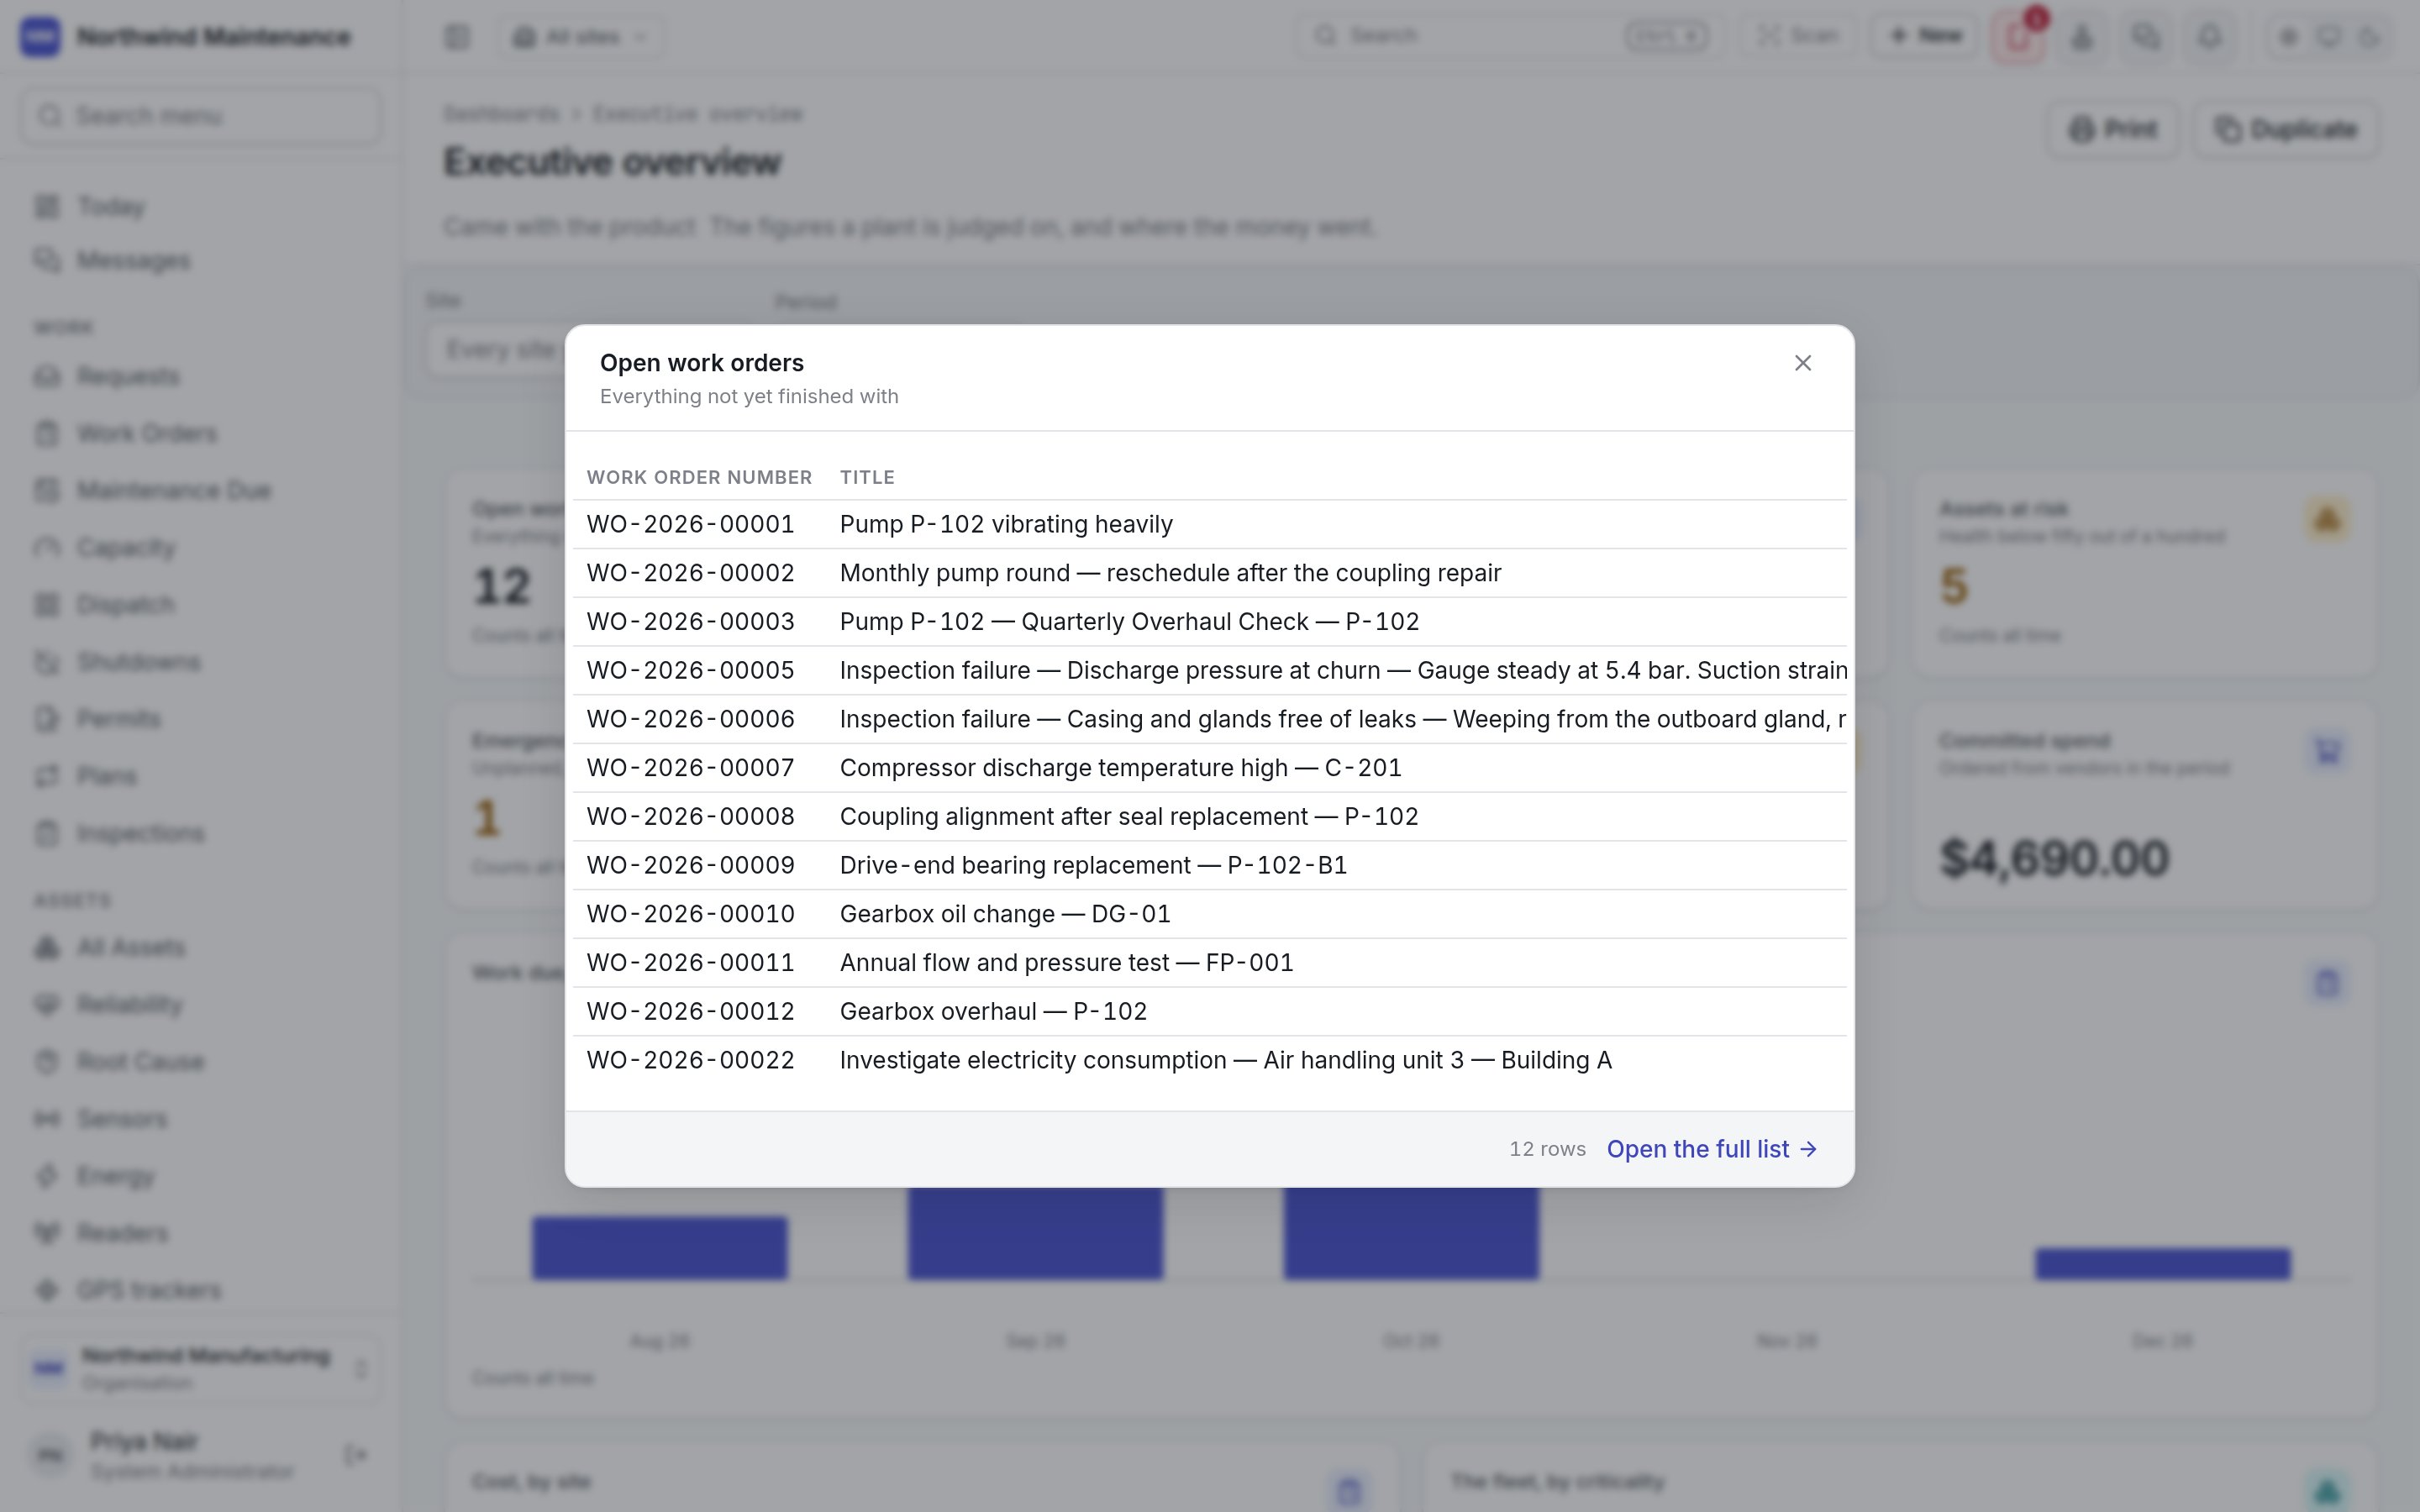
How a tile tells you whether a figure is good
A tile whose author marked the figure as a verdict is coloured: green when it is on the good side of its thresholds, amber past the amber threshold and red past the red one. A tile with a target names it underneath (“Target 95%”), and a chart draws its target as a reference line. A tile that could not be run says This widget could not be run rather than showing a blank, and a widget with no rows says Nothing to show. Under the board, Sent on a schedule lists the board’s schedules and What went out lists what was delivered — see Sending a board on a schedule.Arranging a board
Open one of your own boards and press Arrange. A toolbar appears under the filter bar, and each widget grows a row of controls when you point at it.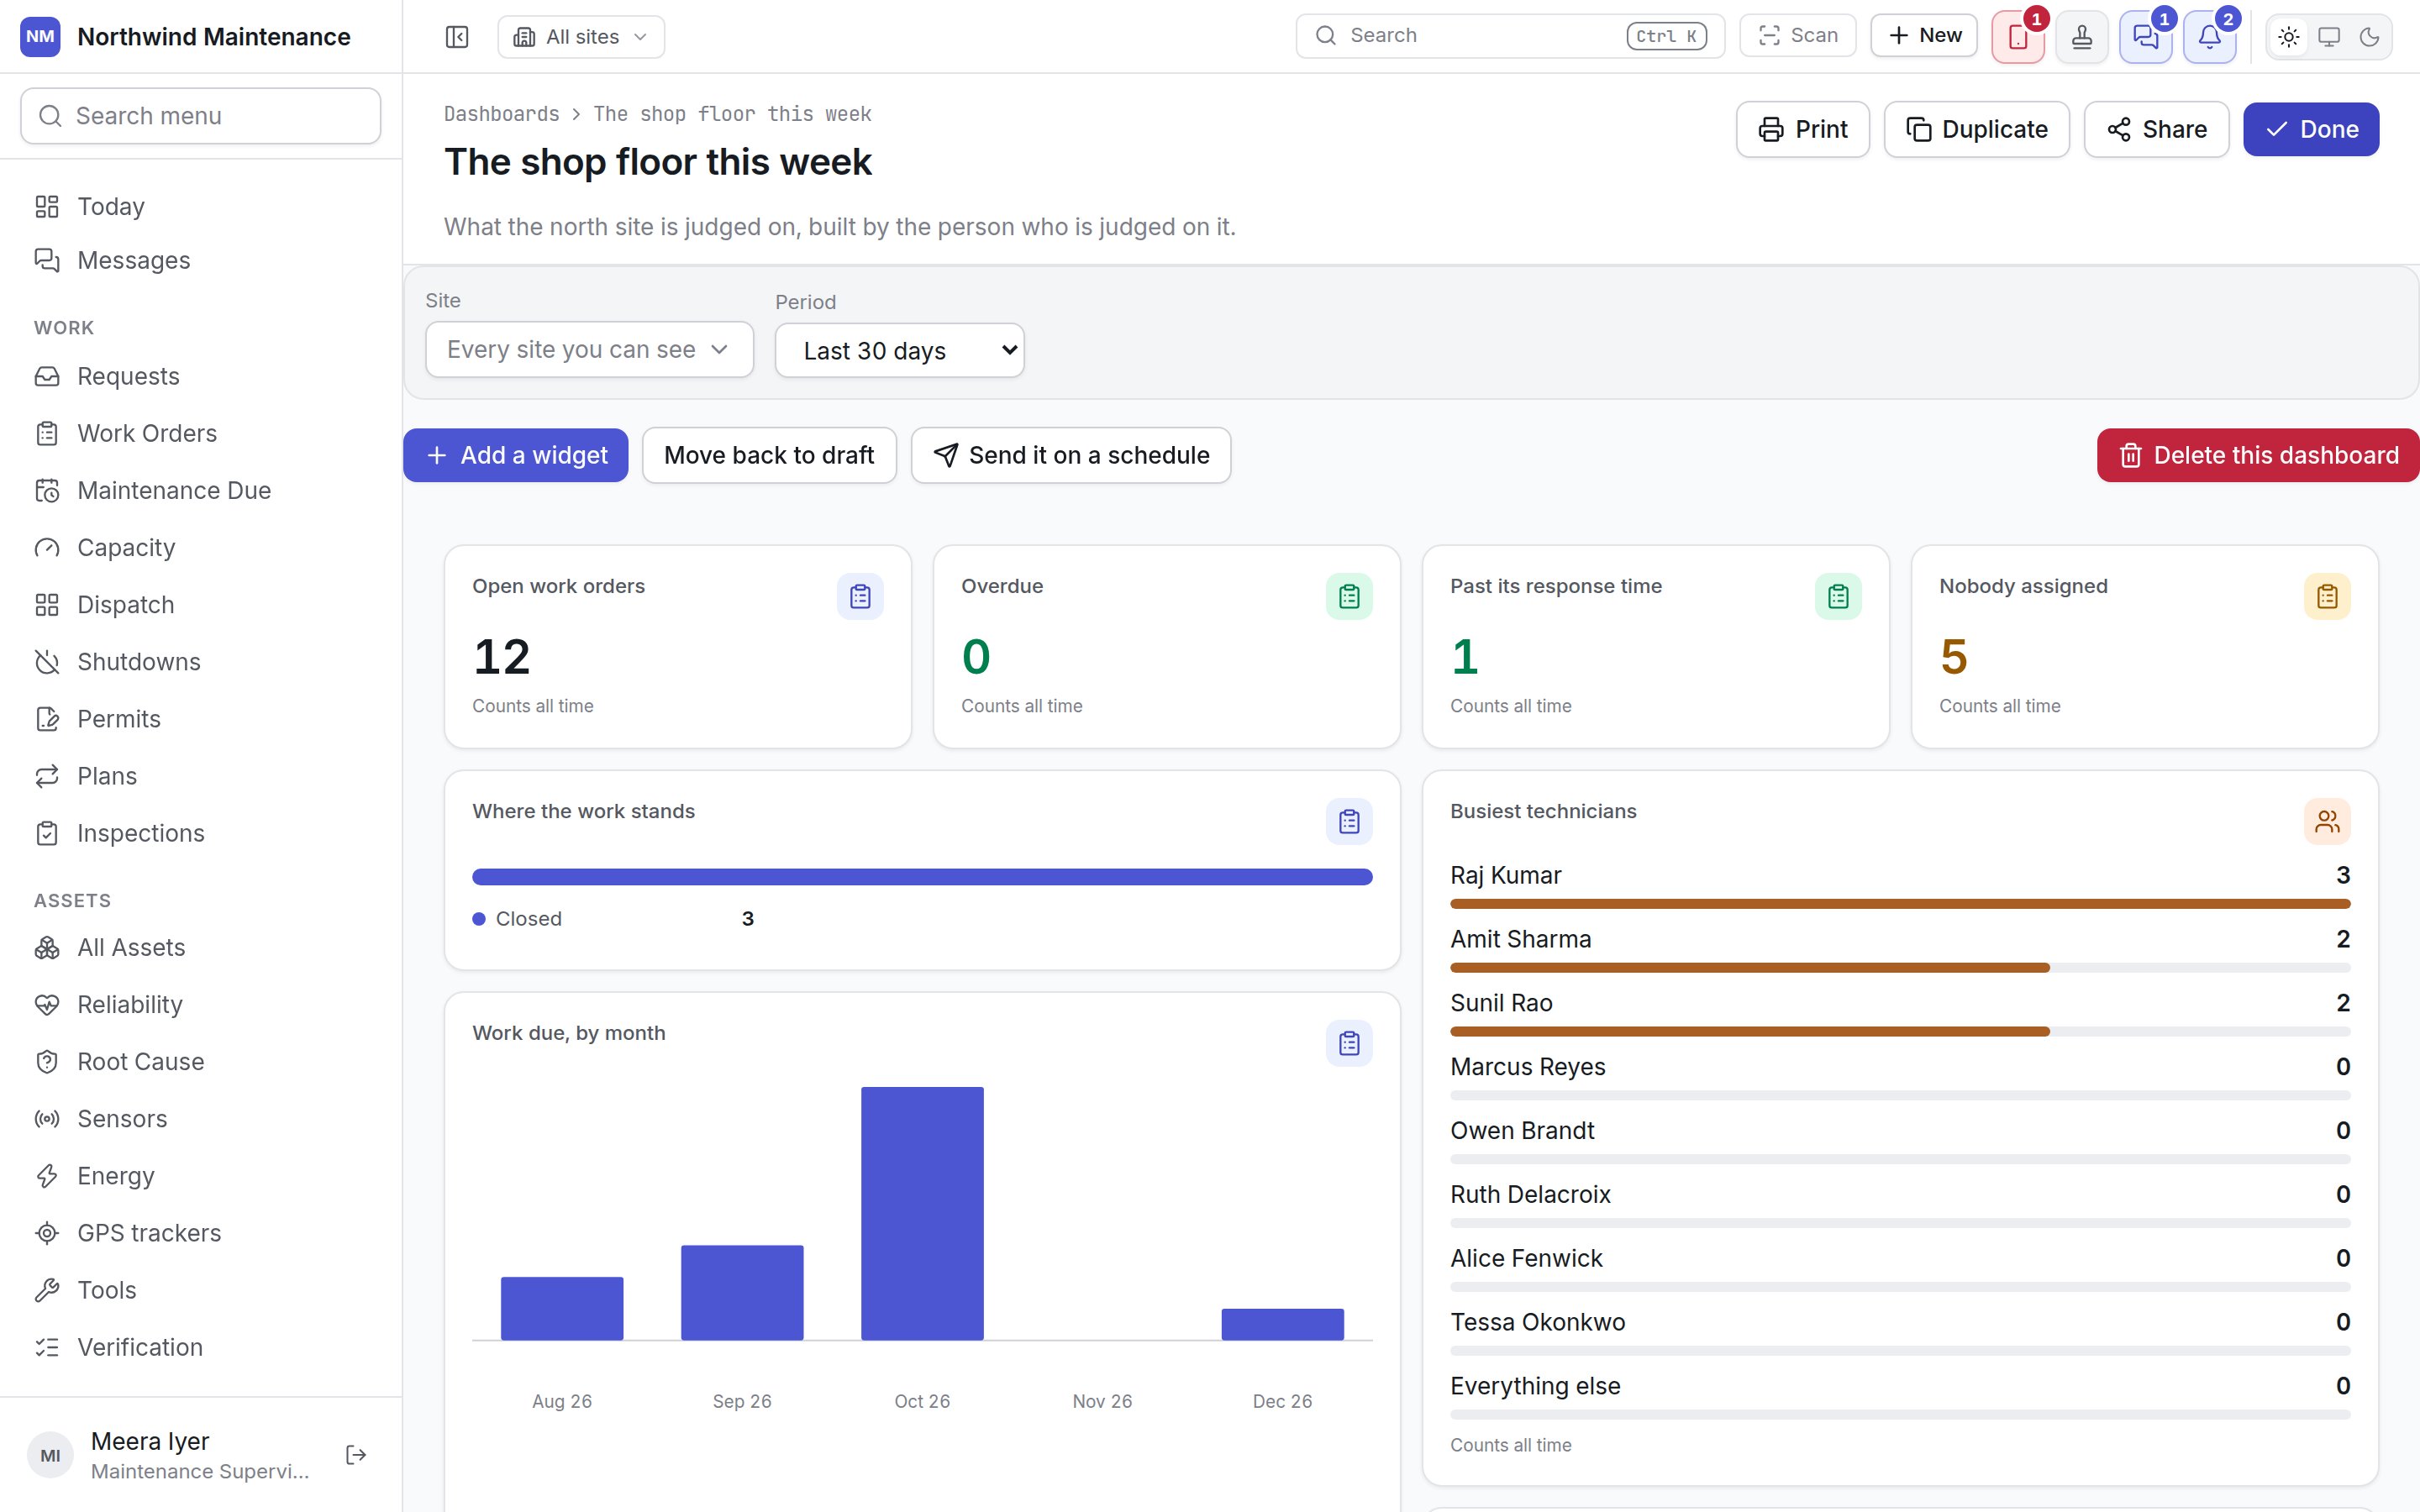
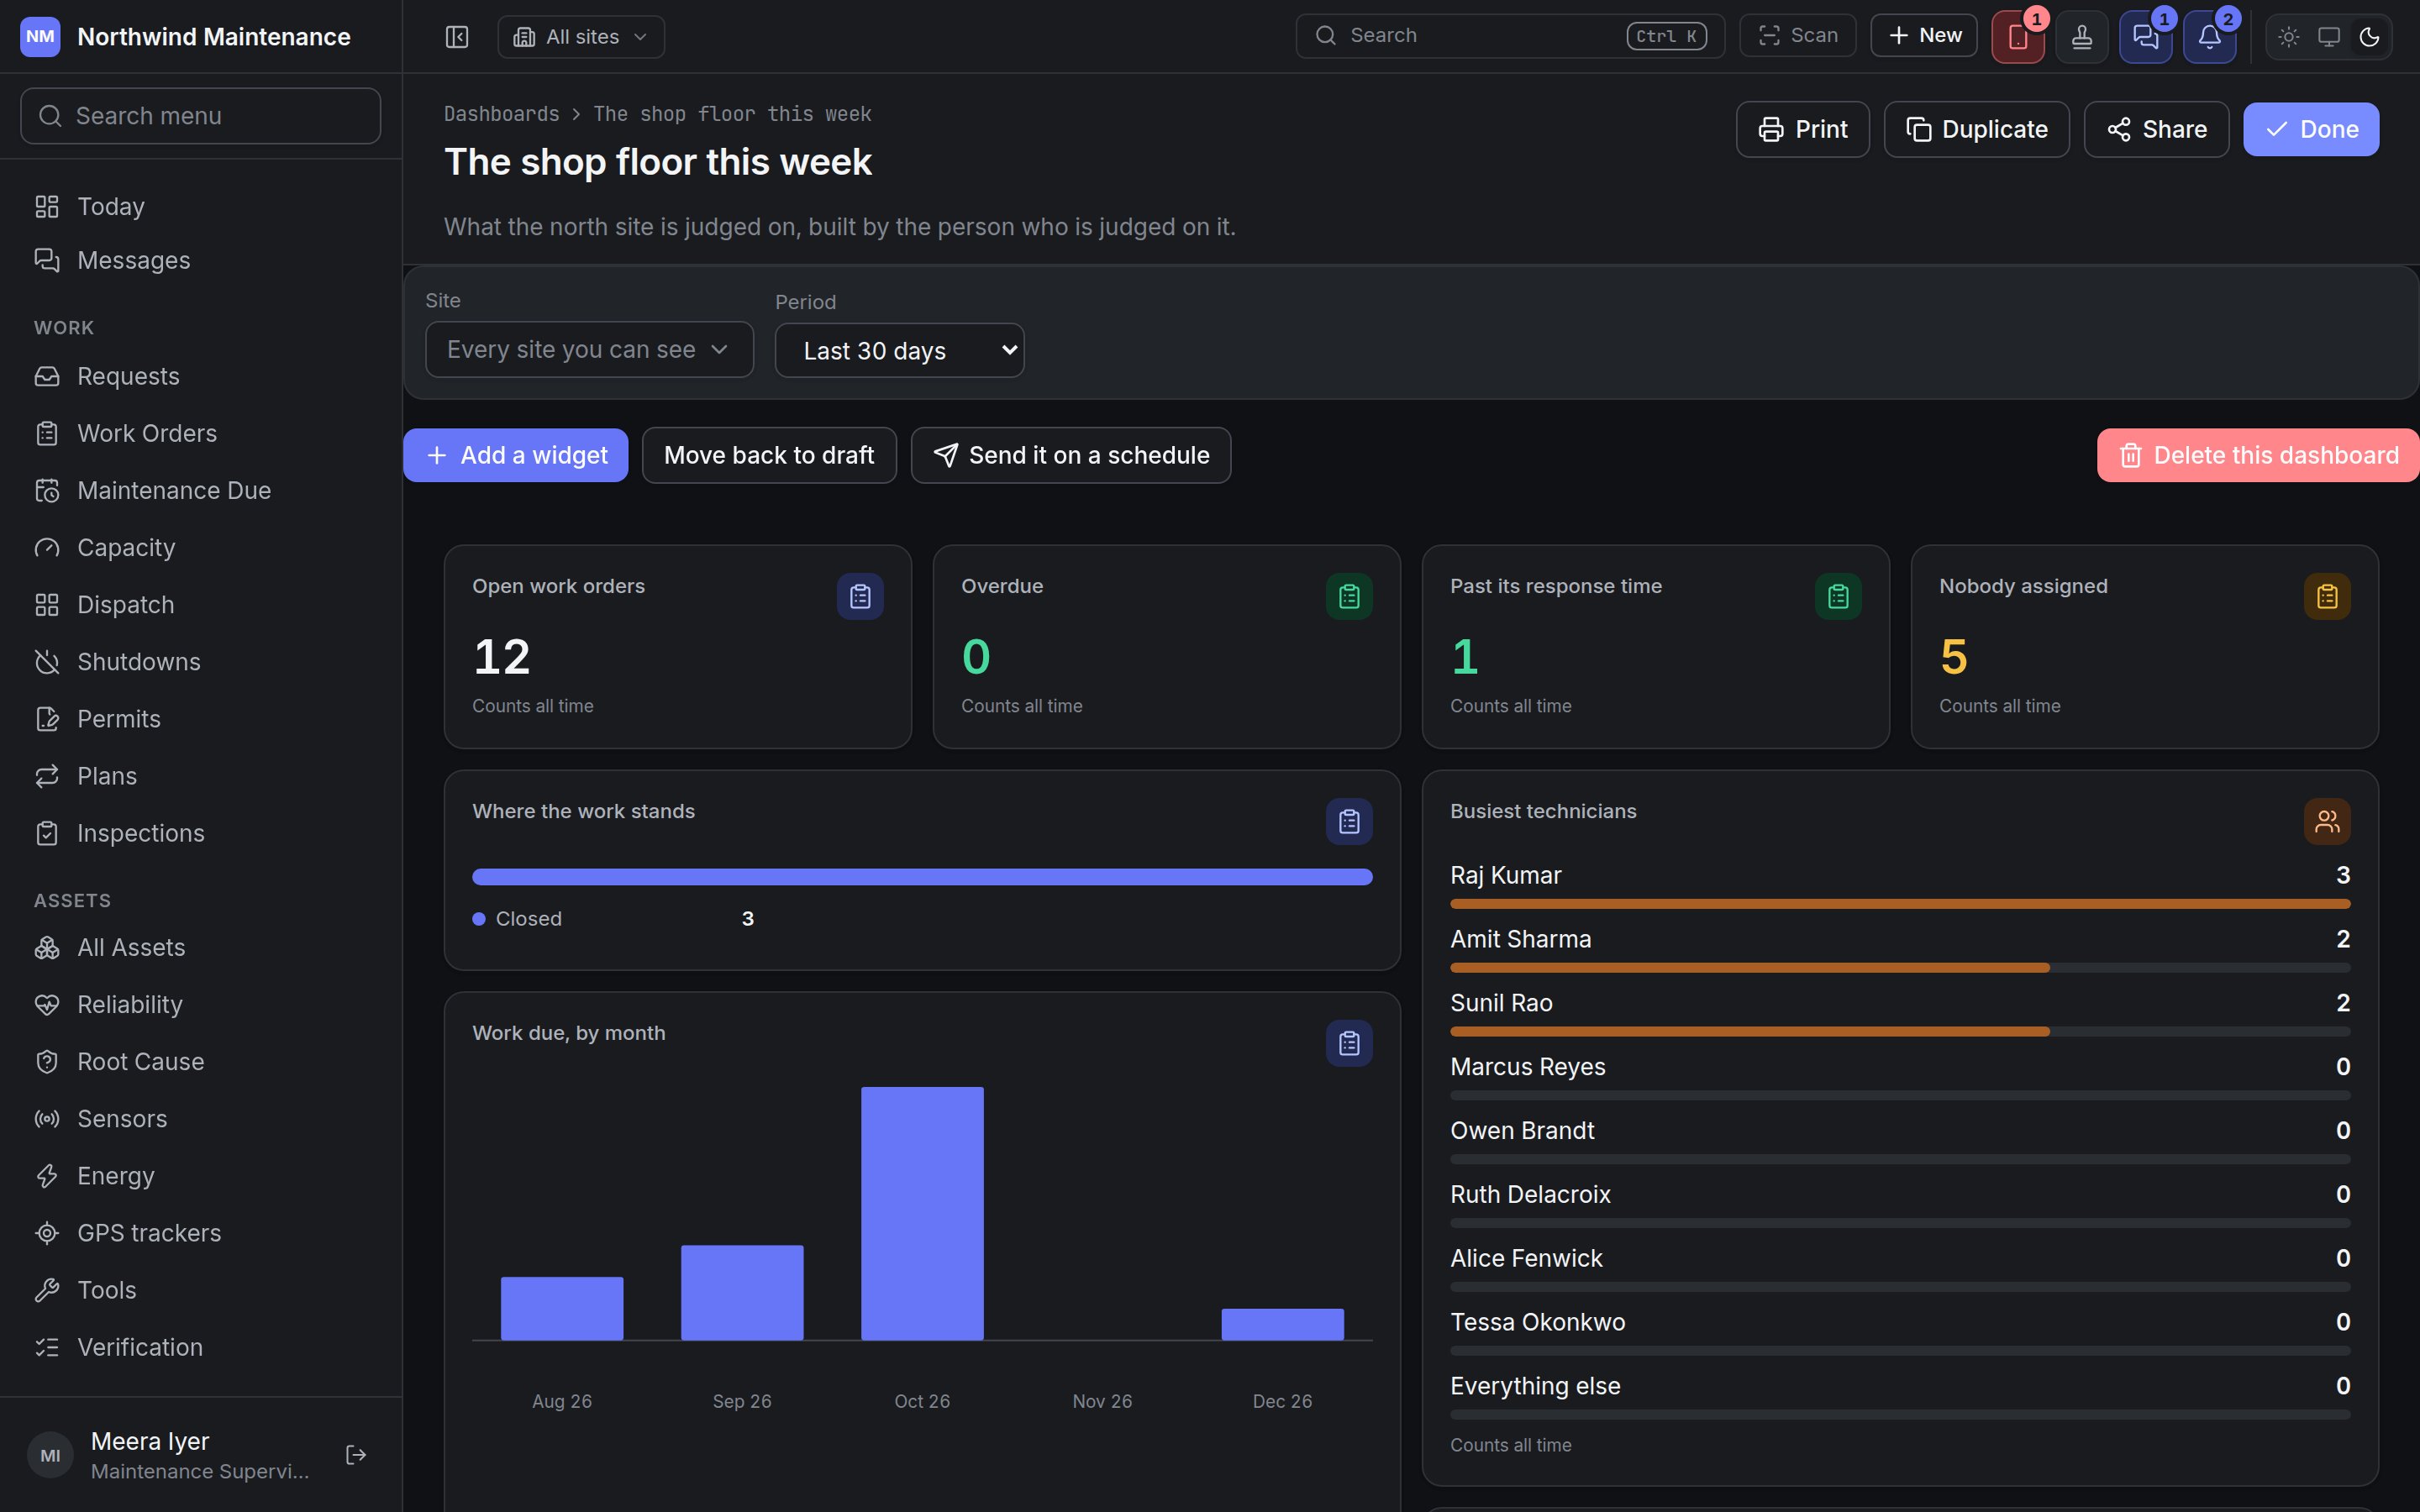
The controls on each widget
A board is a reading order and a width, not a free canvas. Widgets fill a twelve-column grid from left to right and wrap, so the same board reads correctly on a laptop, on a phone and on a printed page. Nothing can overlap and no gap is left behind when you remove a widget.
On a narrow screen a widget may be drawn wider than you arranged it, so its figure stays readable.
It is never drawn narrower.
Press Done to leave Arrange mode. Every change is saved as you make it.
Building a widget
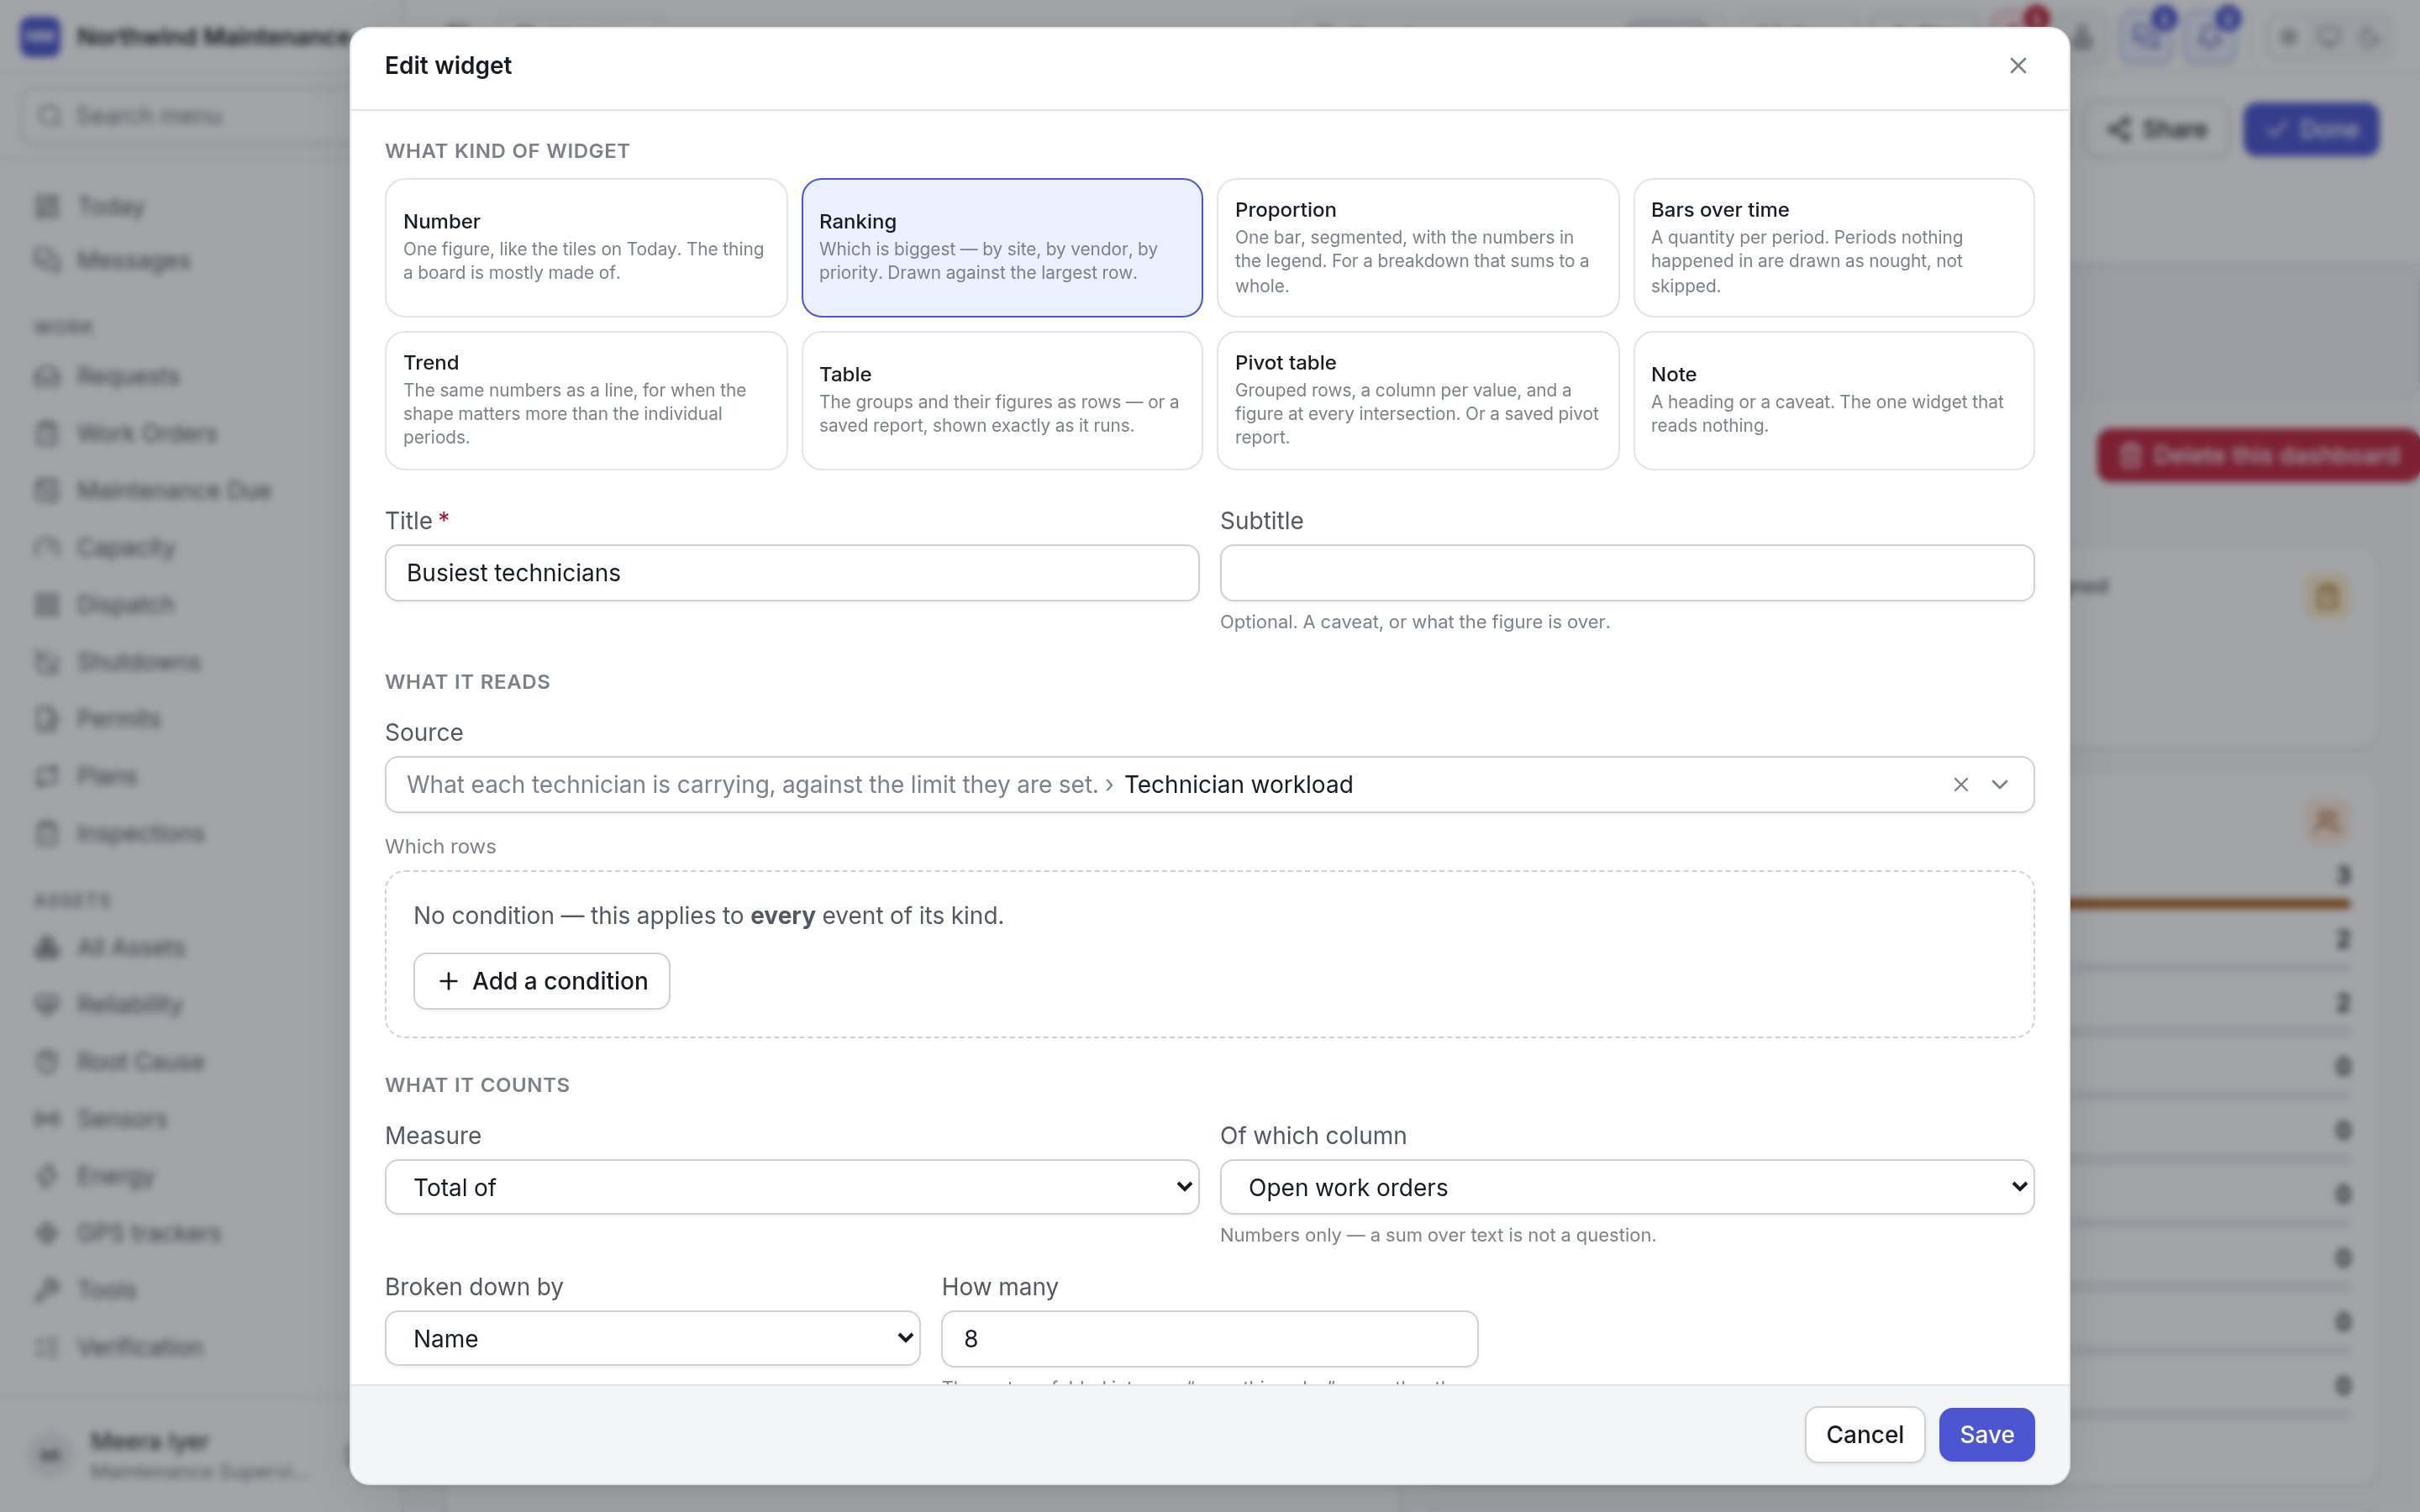
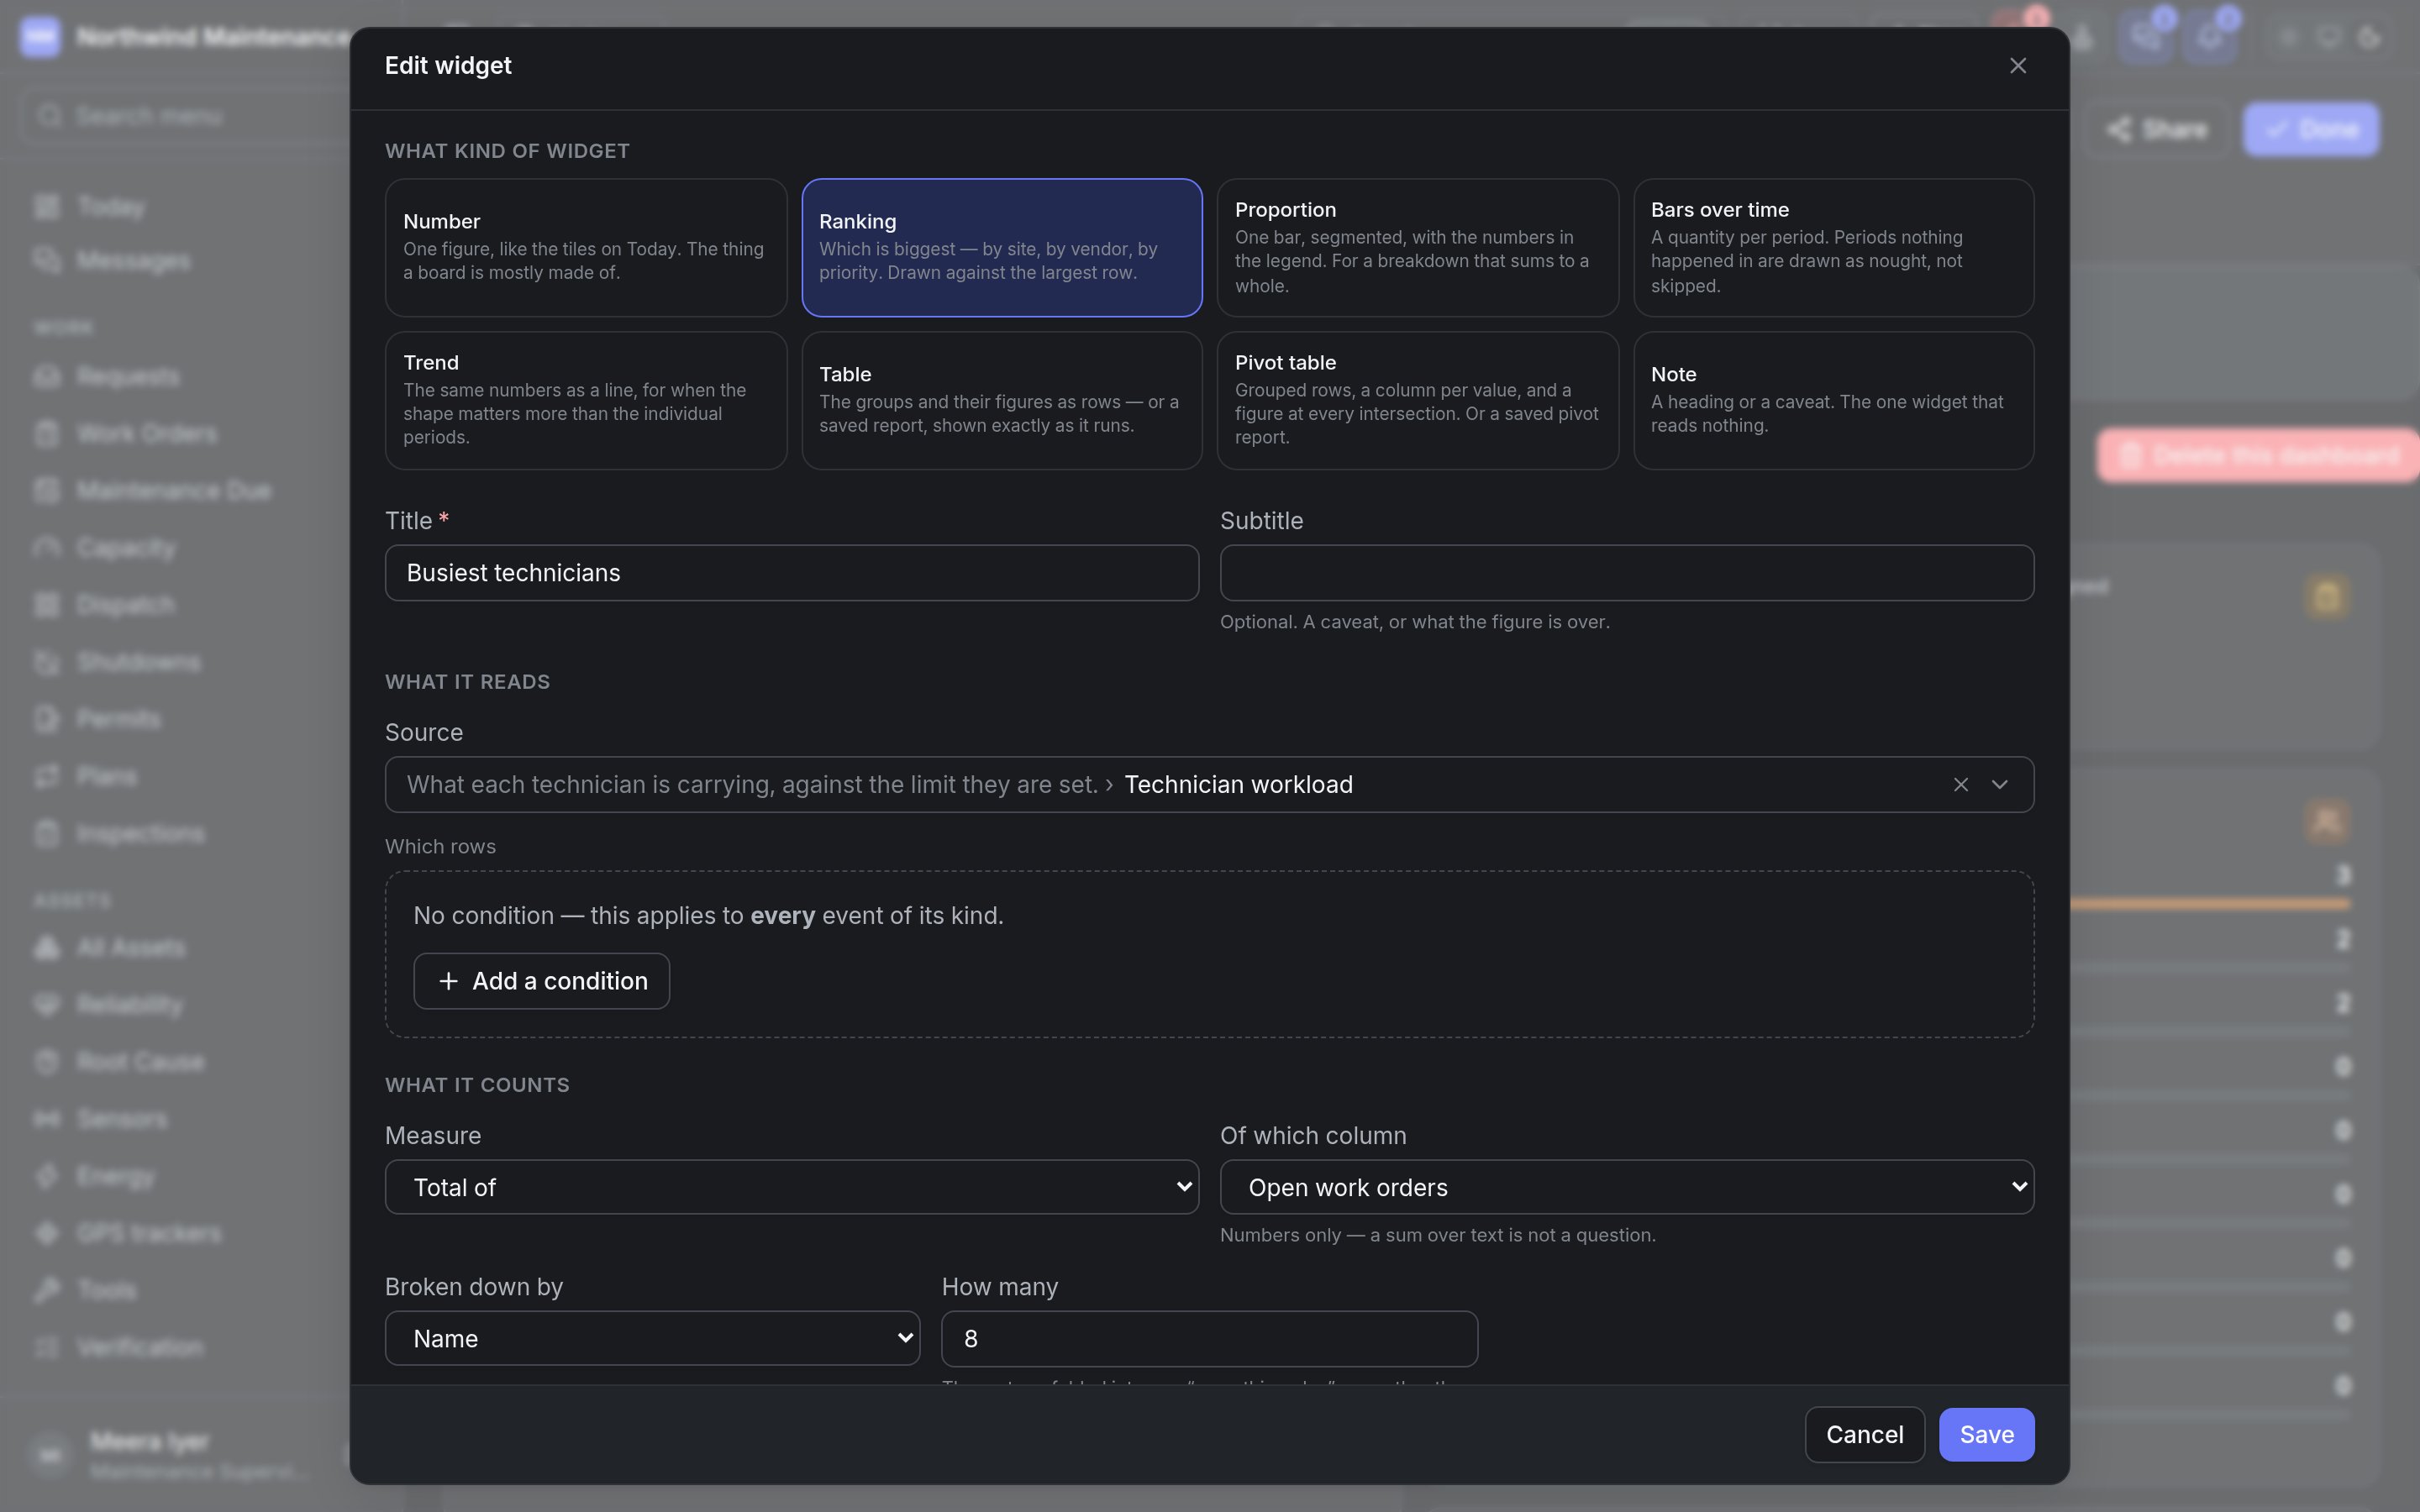
Add a widget, or clicking a widget in Arrange mode, opens the editor. It asks its questions in the order you answer them: what kind of widget, what it reads, what it counts, what the board’s filter reaches and how it reads. Sections that do not apply to the kind you chose are not shown.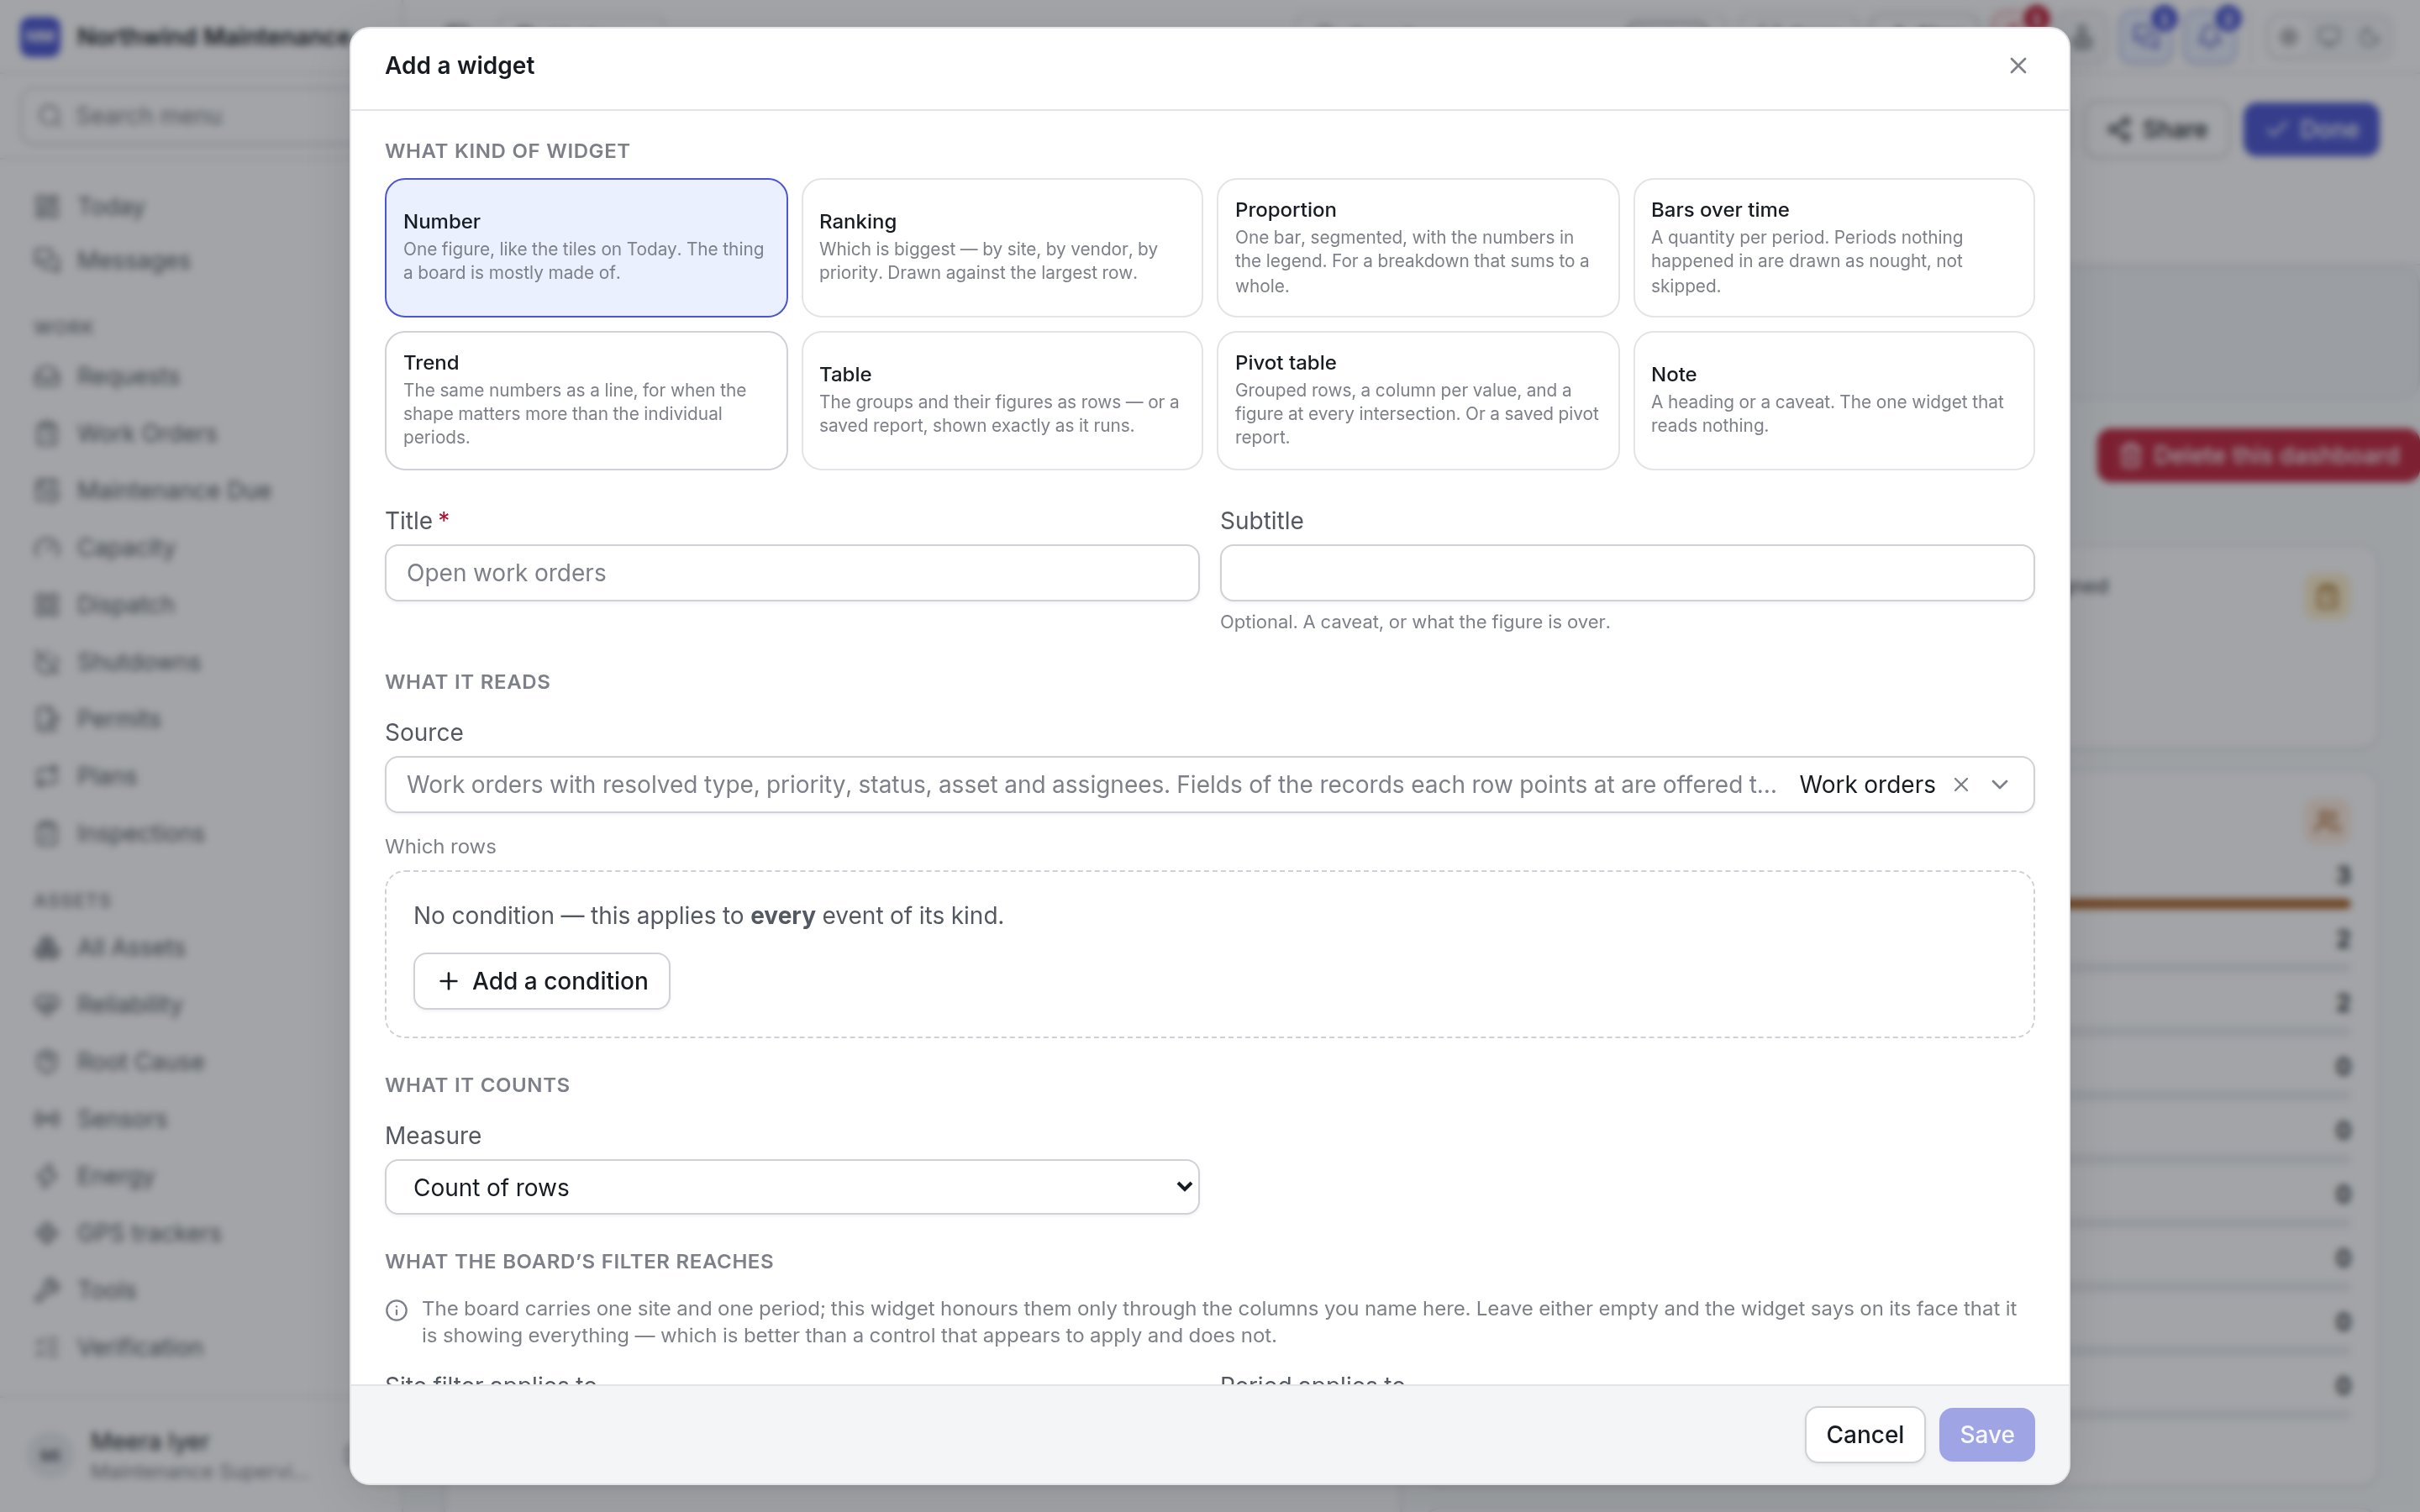
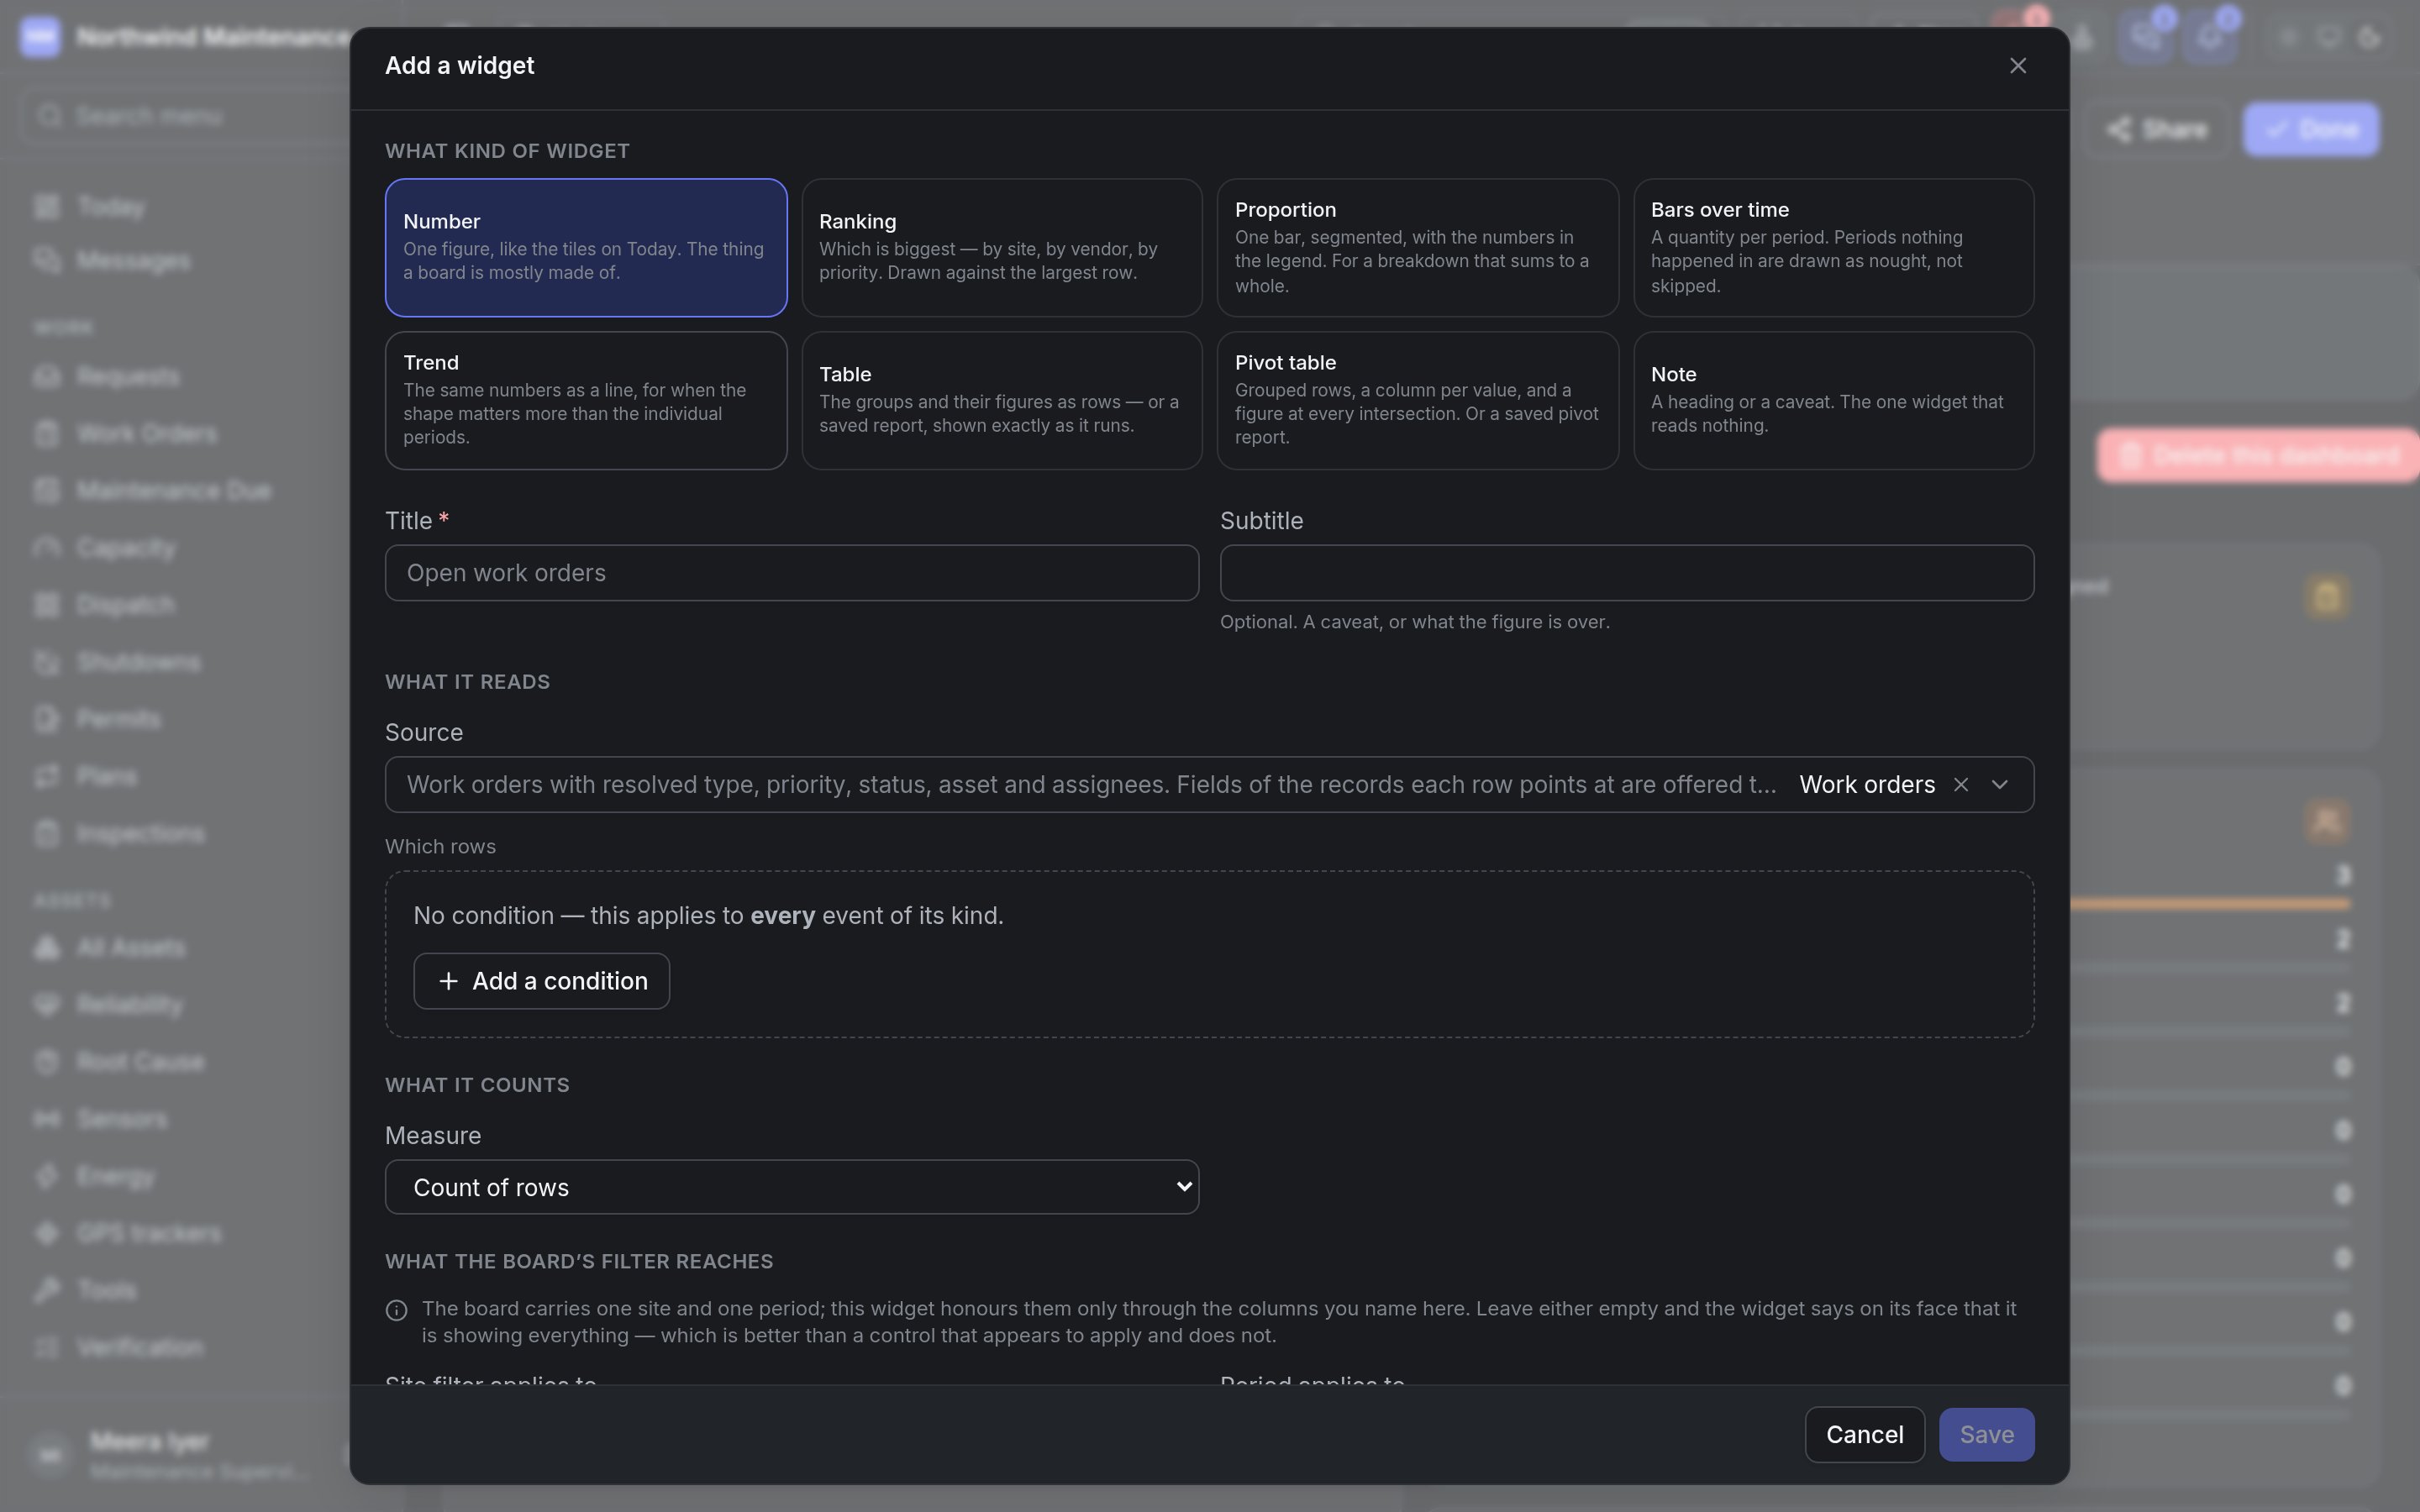
What kind of widget
Changing the kind keeps everything that still applies and clears anything the new kind cannot use —
a Number has no breakdown, and only Bars over time and Trend have a period size.
The fields
Save stays unavailable until the widget has everything its kind needs.
The column lists can be long, because a source offers both its own columns and the columns of the
records each row points at — a work order’s asset, site, team and so on. The record’s own columns come
first; borrowed ones are grouped under the record they came from.
A pivot table widget
Choosing Pivot table replaces the measure fields with the same builder the report builder uses for Counts and totals:What the board’s filter reaches
Leave either empty and the widget says on its face that it is counting everything, which is better
than a control that appears to apply and does not.
How it reads
Keeping a Copilot chart on a board
Where your organisation uses Copilot, a question answered with a chart offers Keep this beside a Choose a board… list of your own boards. The chart is added to the board as an ordinary widget, which you can then move, resize and edit like any other. It needs permission to create dashboards.Sharing a board
Share, on a board you own, opens Who is this dashboard for? The dialog repeats the warning from the list: sharing decides whose list the board appears in, never what it may show, and the board stays read-only for everybody but you.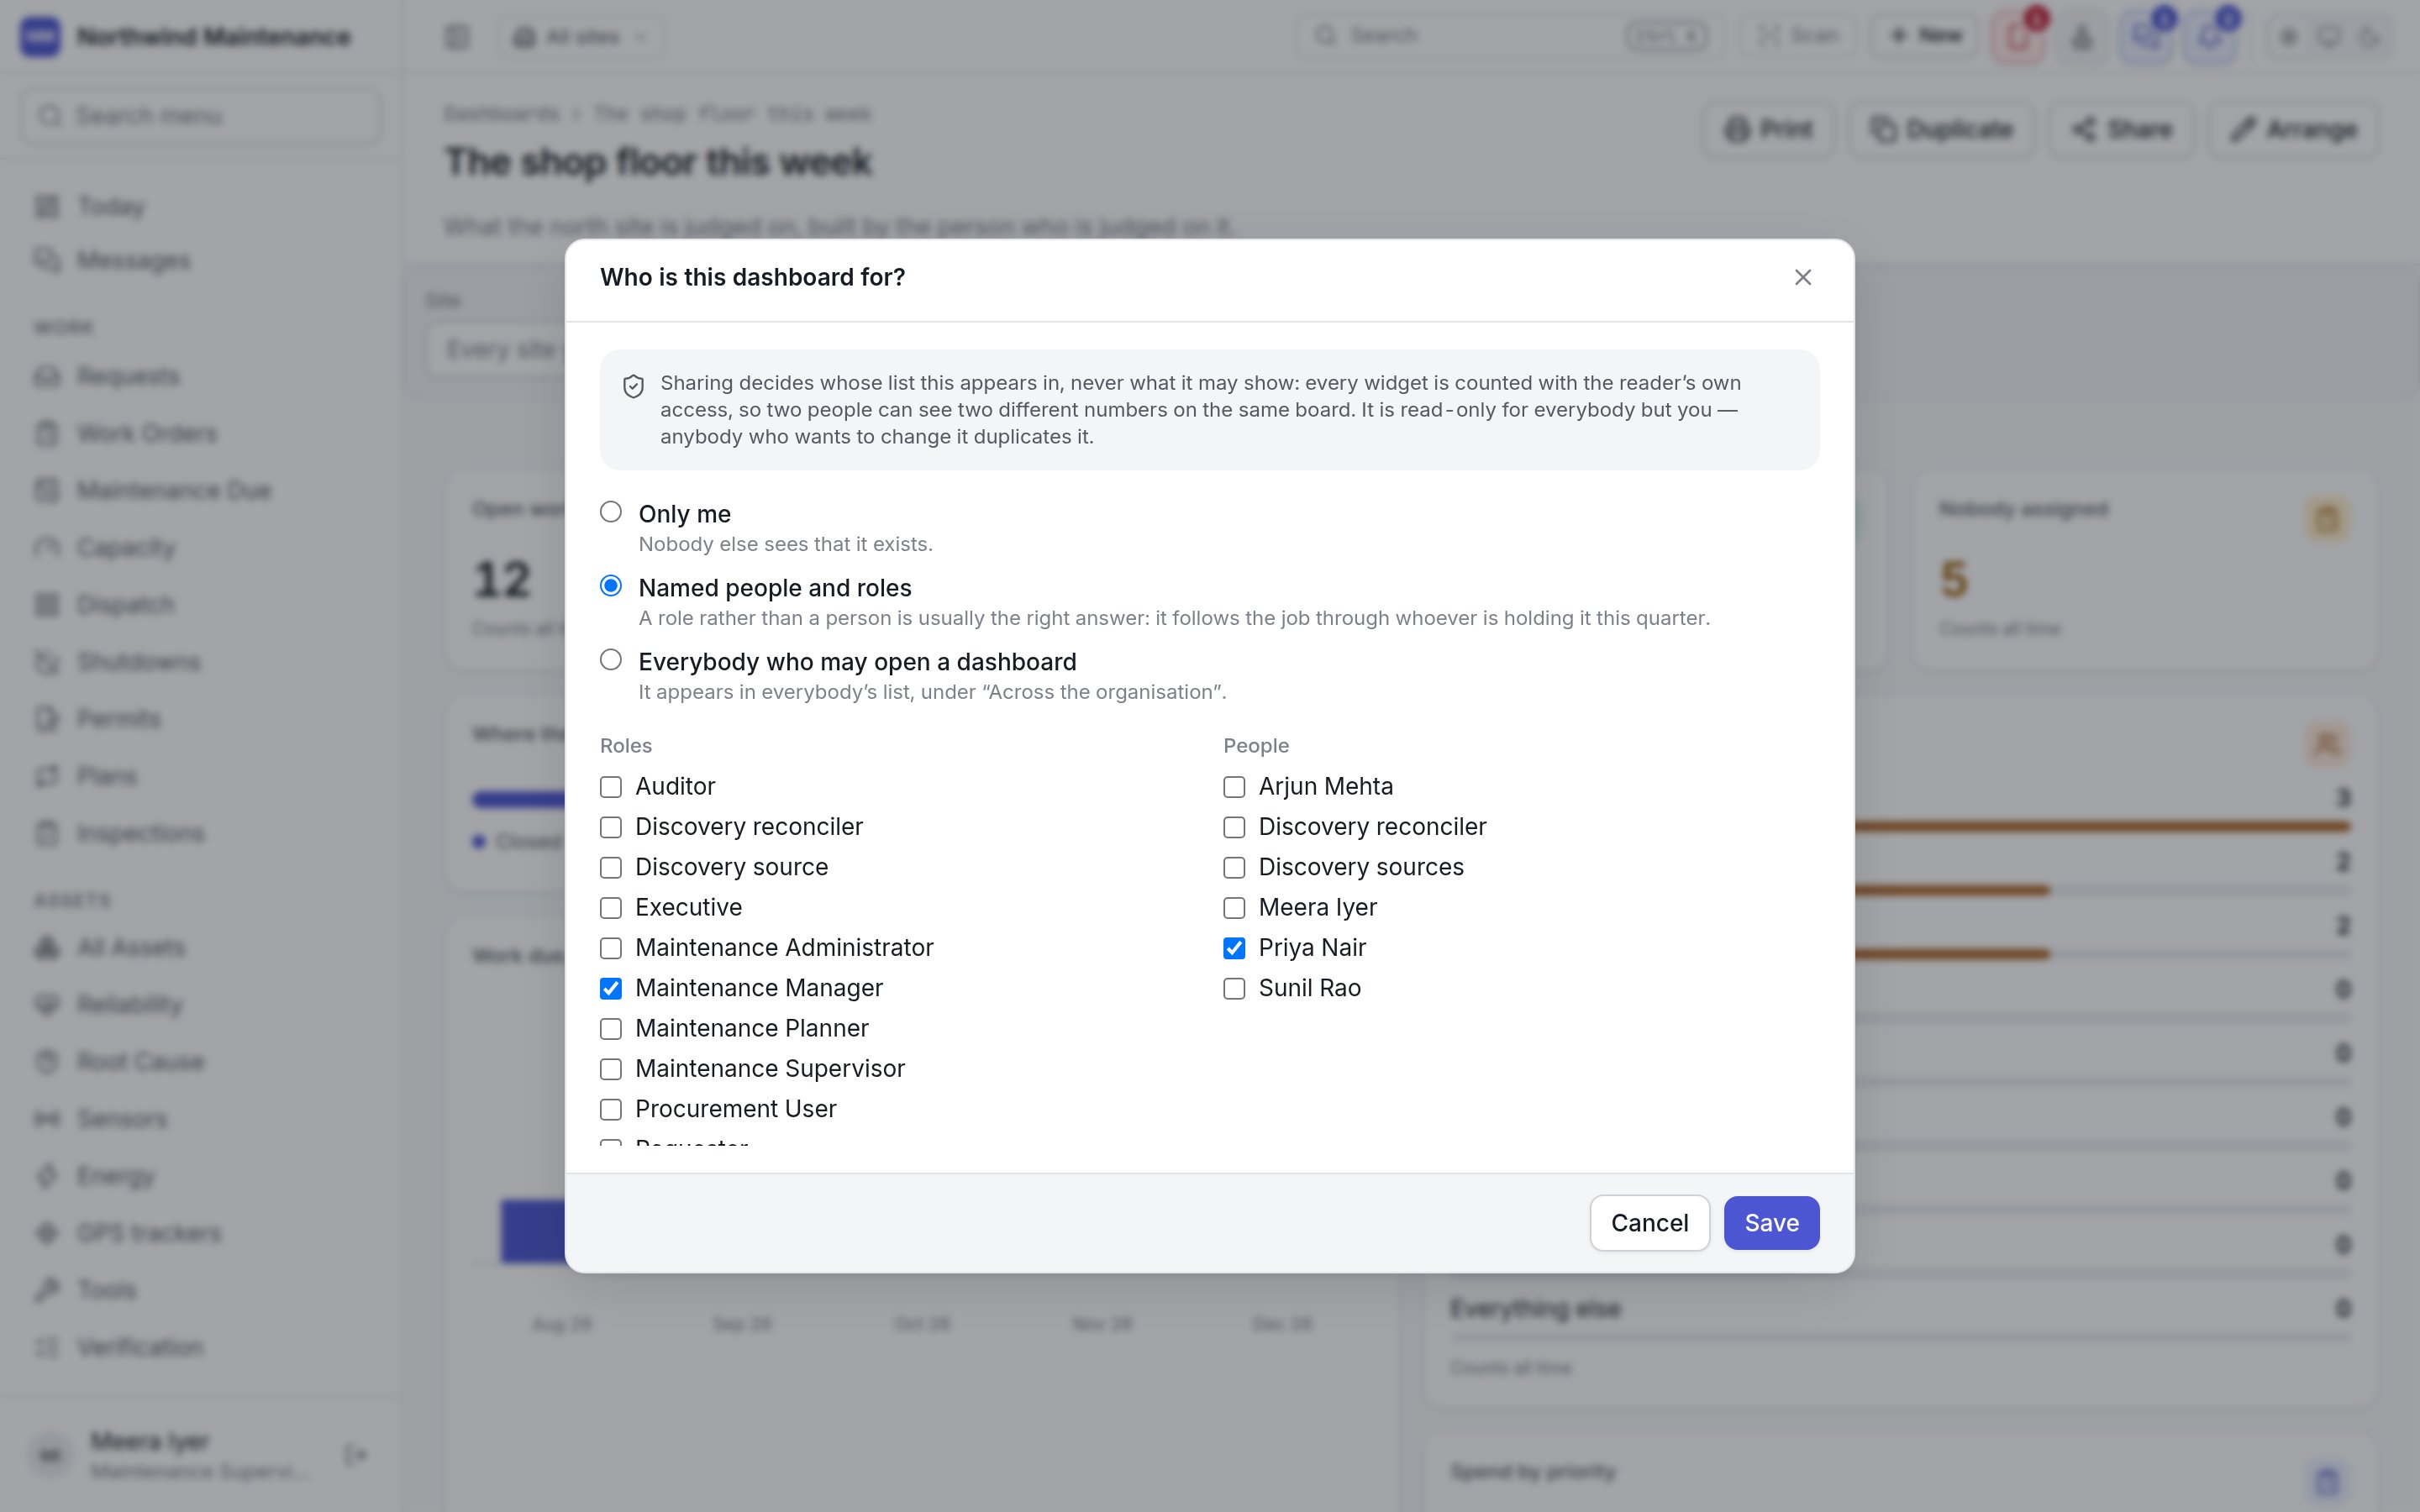
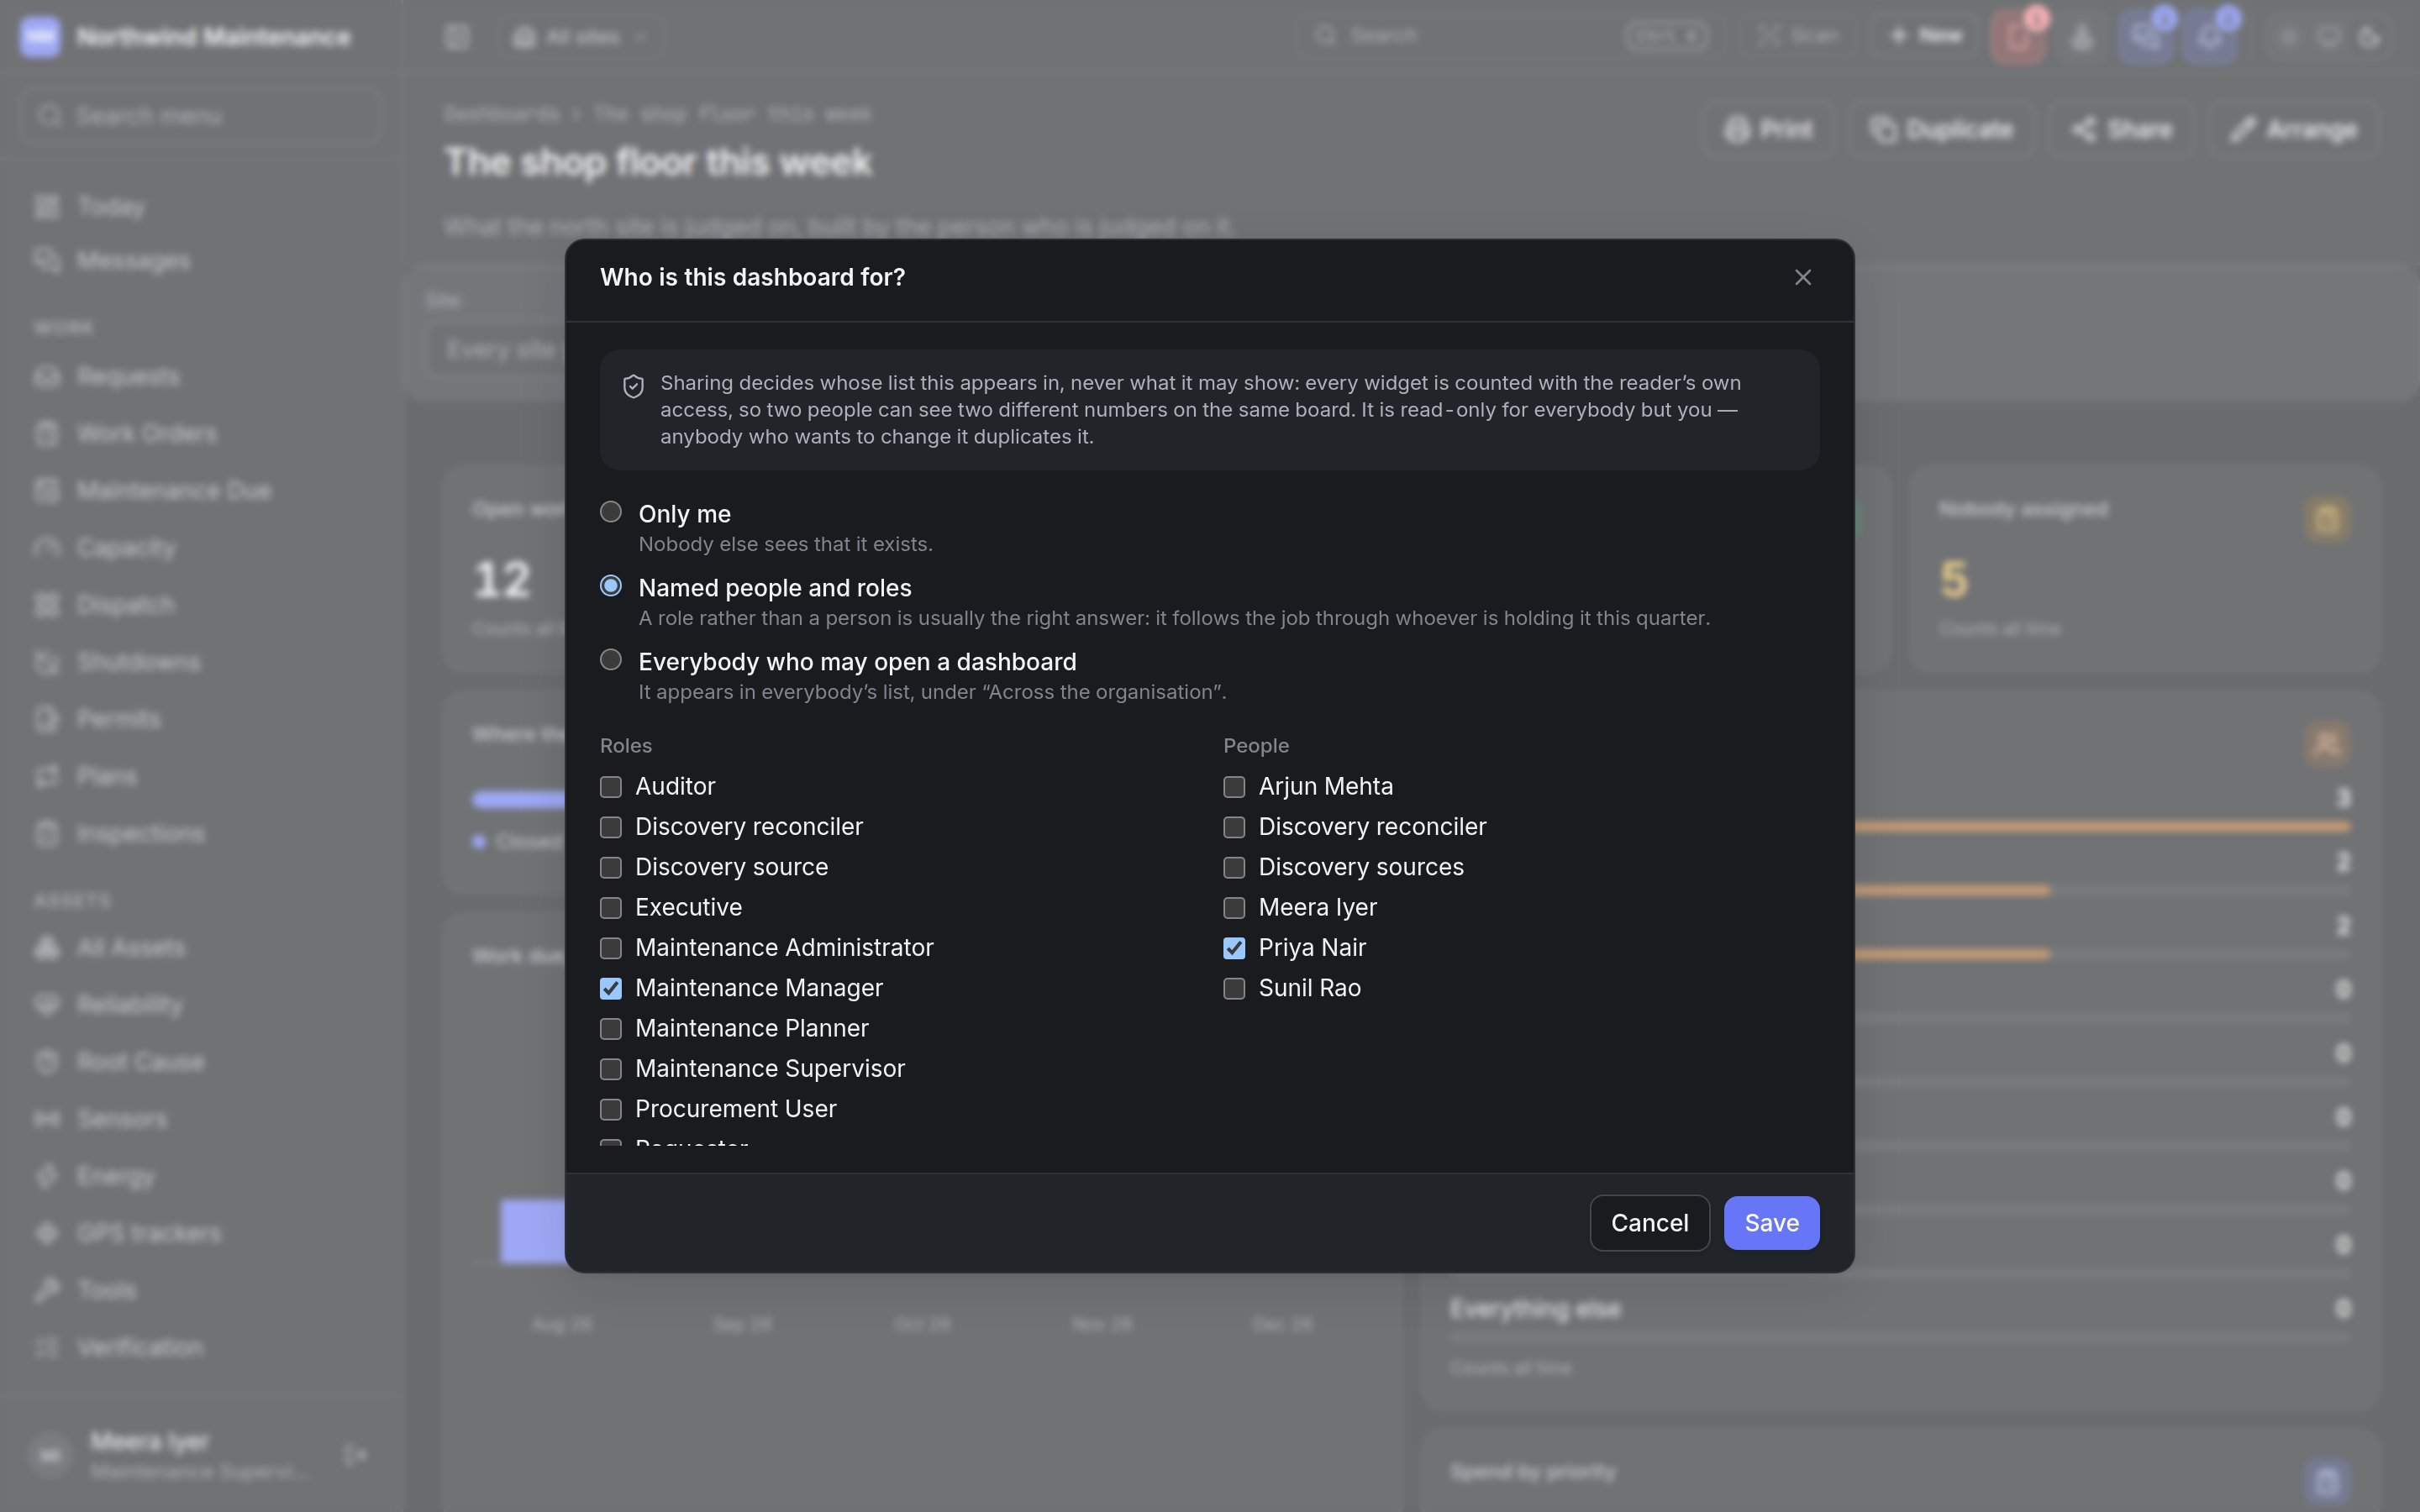
A role is usually the better choice than a person: it follows the job through whoever holds it this
quarter. Save replaces the whole audience in one go.
Nobody you share with can change your board. Anyone who wants a version of their own presses
Duplicate.
Sending a board on a schedule
Send it on a schedule (in Arrange mode) opens Send this dashboard. A scheduled board is drawn by the product, saved as a file and sent to each recipient as a notification with a link to it.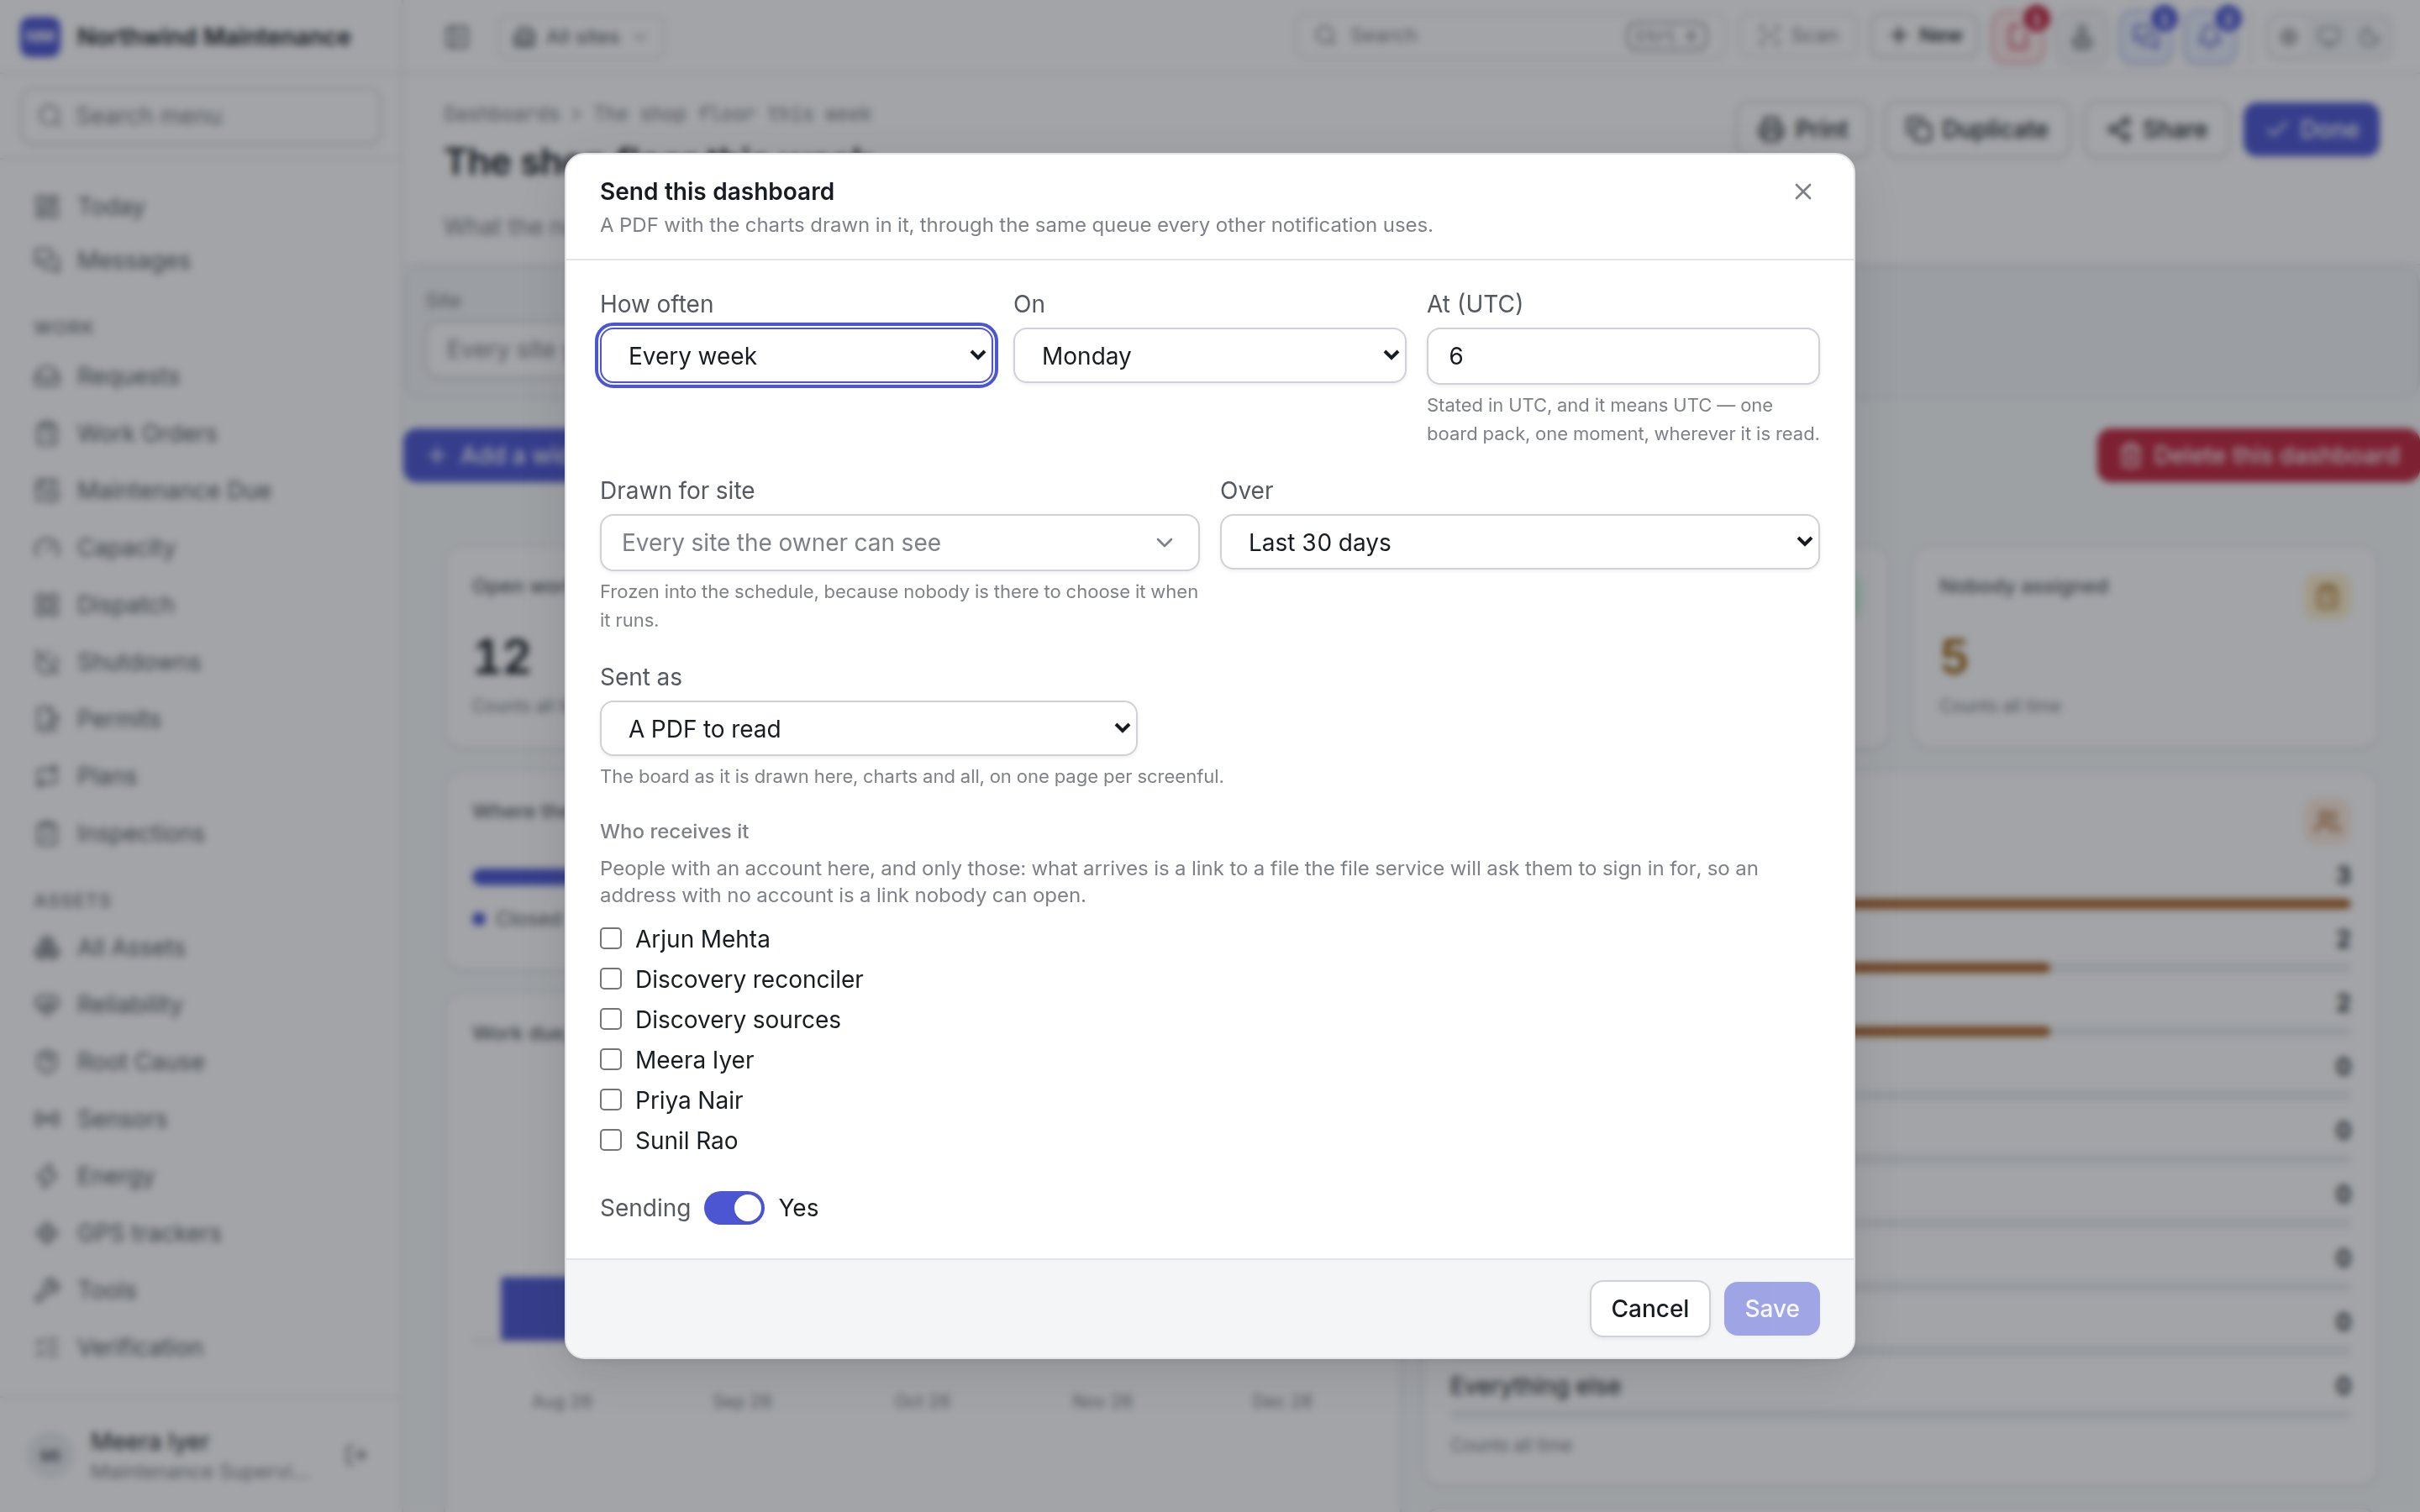
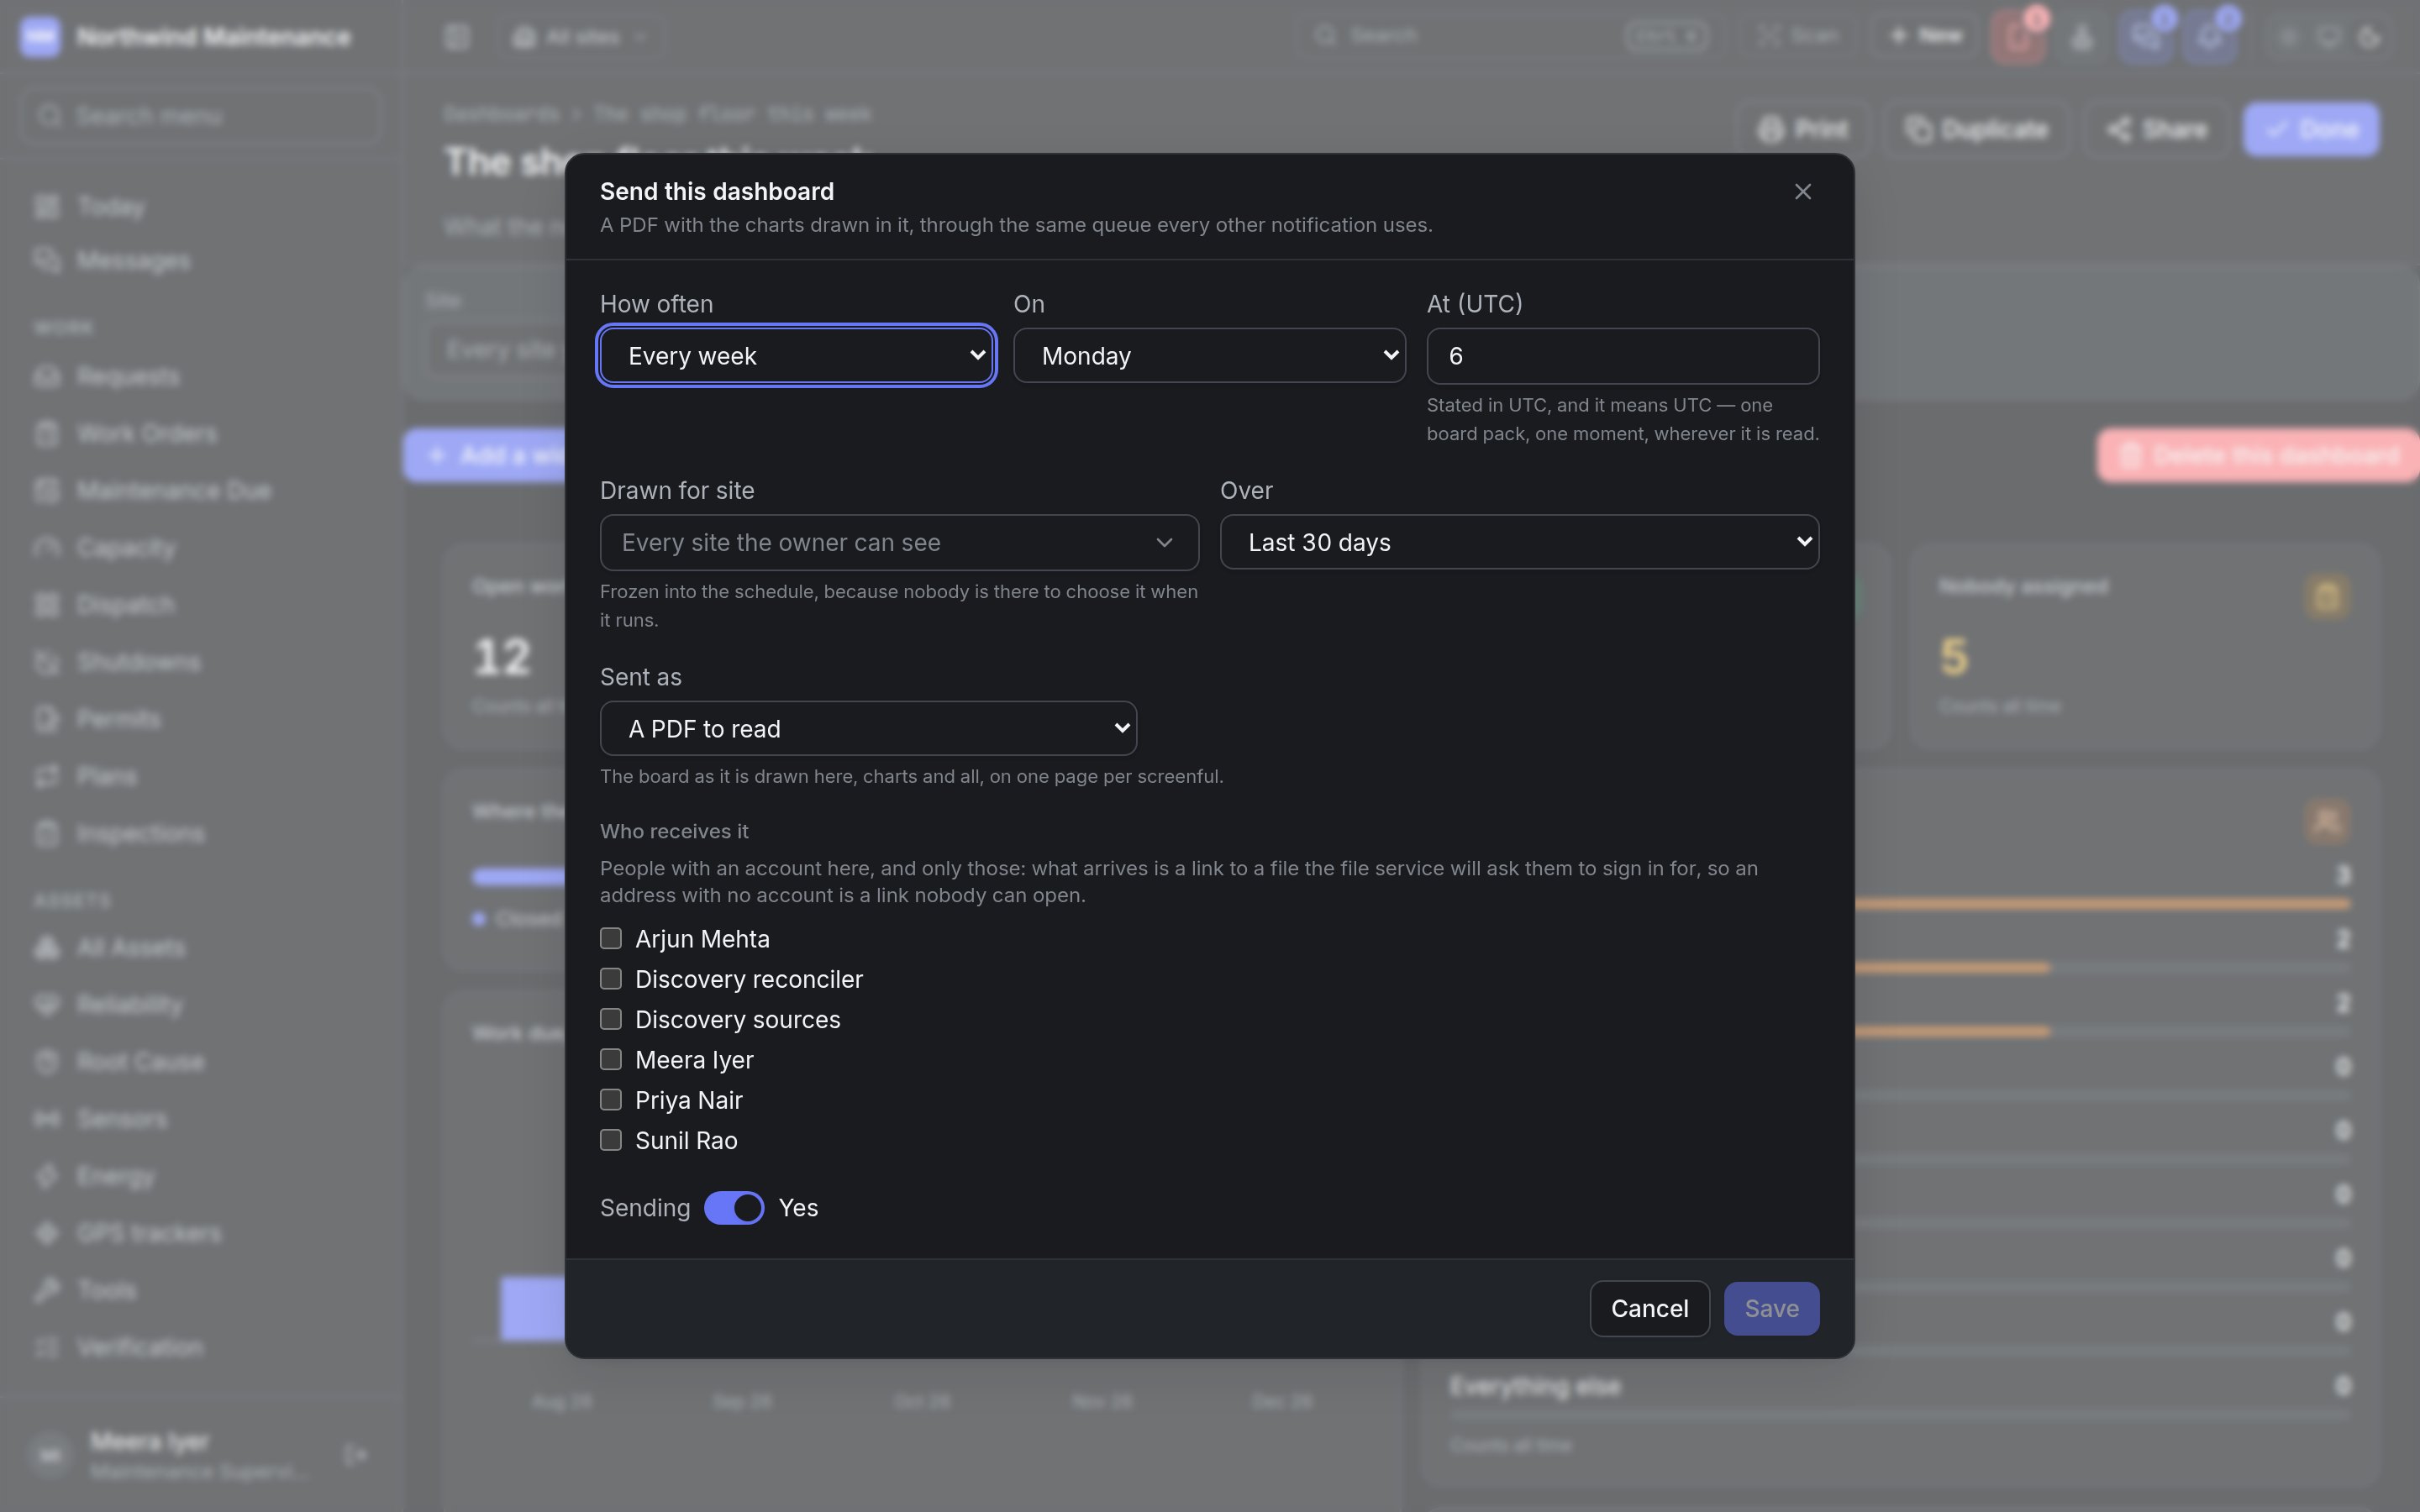
Editing a schedule (its Edit button under the board) opens the same dialog with Stop sending,
which deletes the schedule.
Sent on a schedule
Each schedule is listed under the board with its cadence (“Every week — Monday, 06:00 UTC”), its recipients, its site and period, and two warnings where they apply:What went out
The delivery log under the board answers “did my Monday board go out, and what was in it”.
Anything refused or failed is lifted into its own Not sent table above the log, with the reason
in a sentence — the owner’s account was closed, a recipient is not a user here, the board is still a
draft, it has no widgets, or nobody was named. A schedule that has quietly stopped arriving has no
other symptom, so this is the place to look.
Related
Reports
Saved questions that return rows, which a Table or Pivot table widget can show.
Today's dashboards
The three built-in boards on the home screen.