

Recommendations
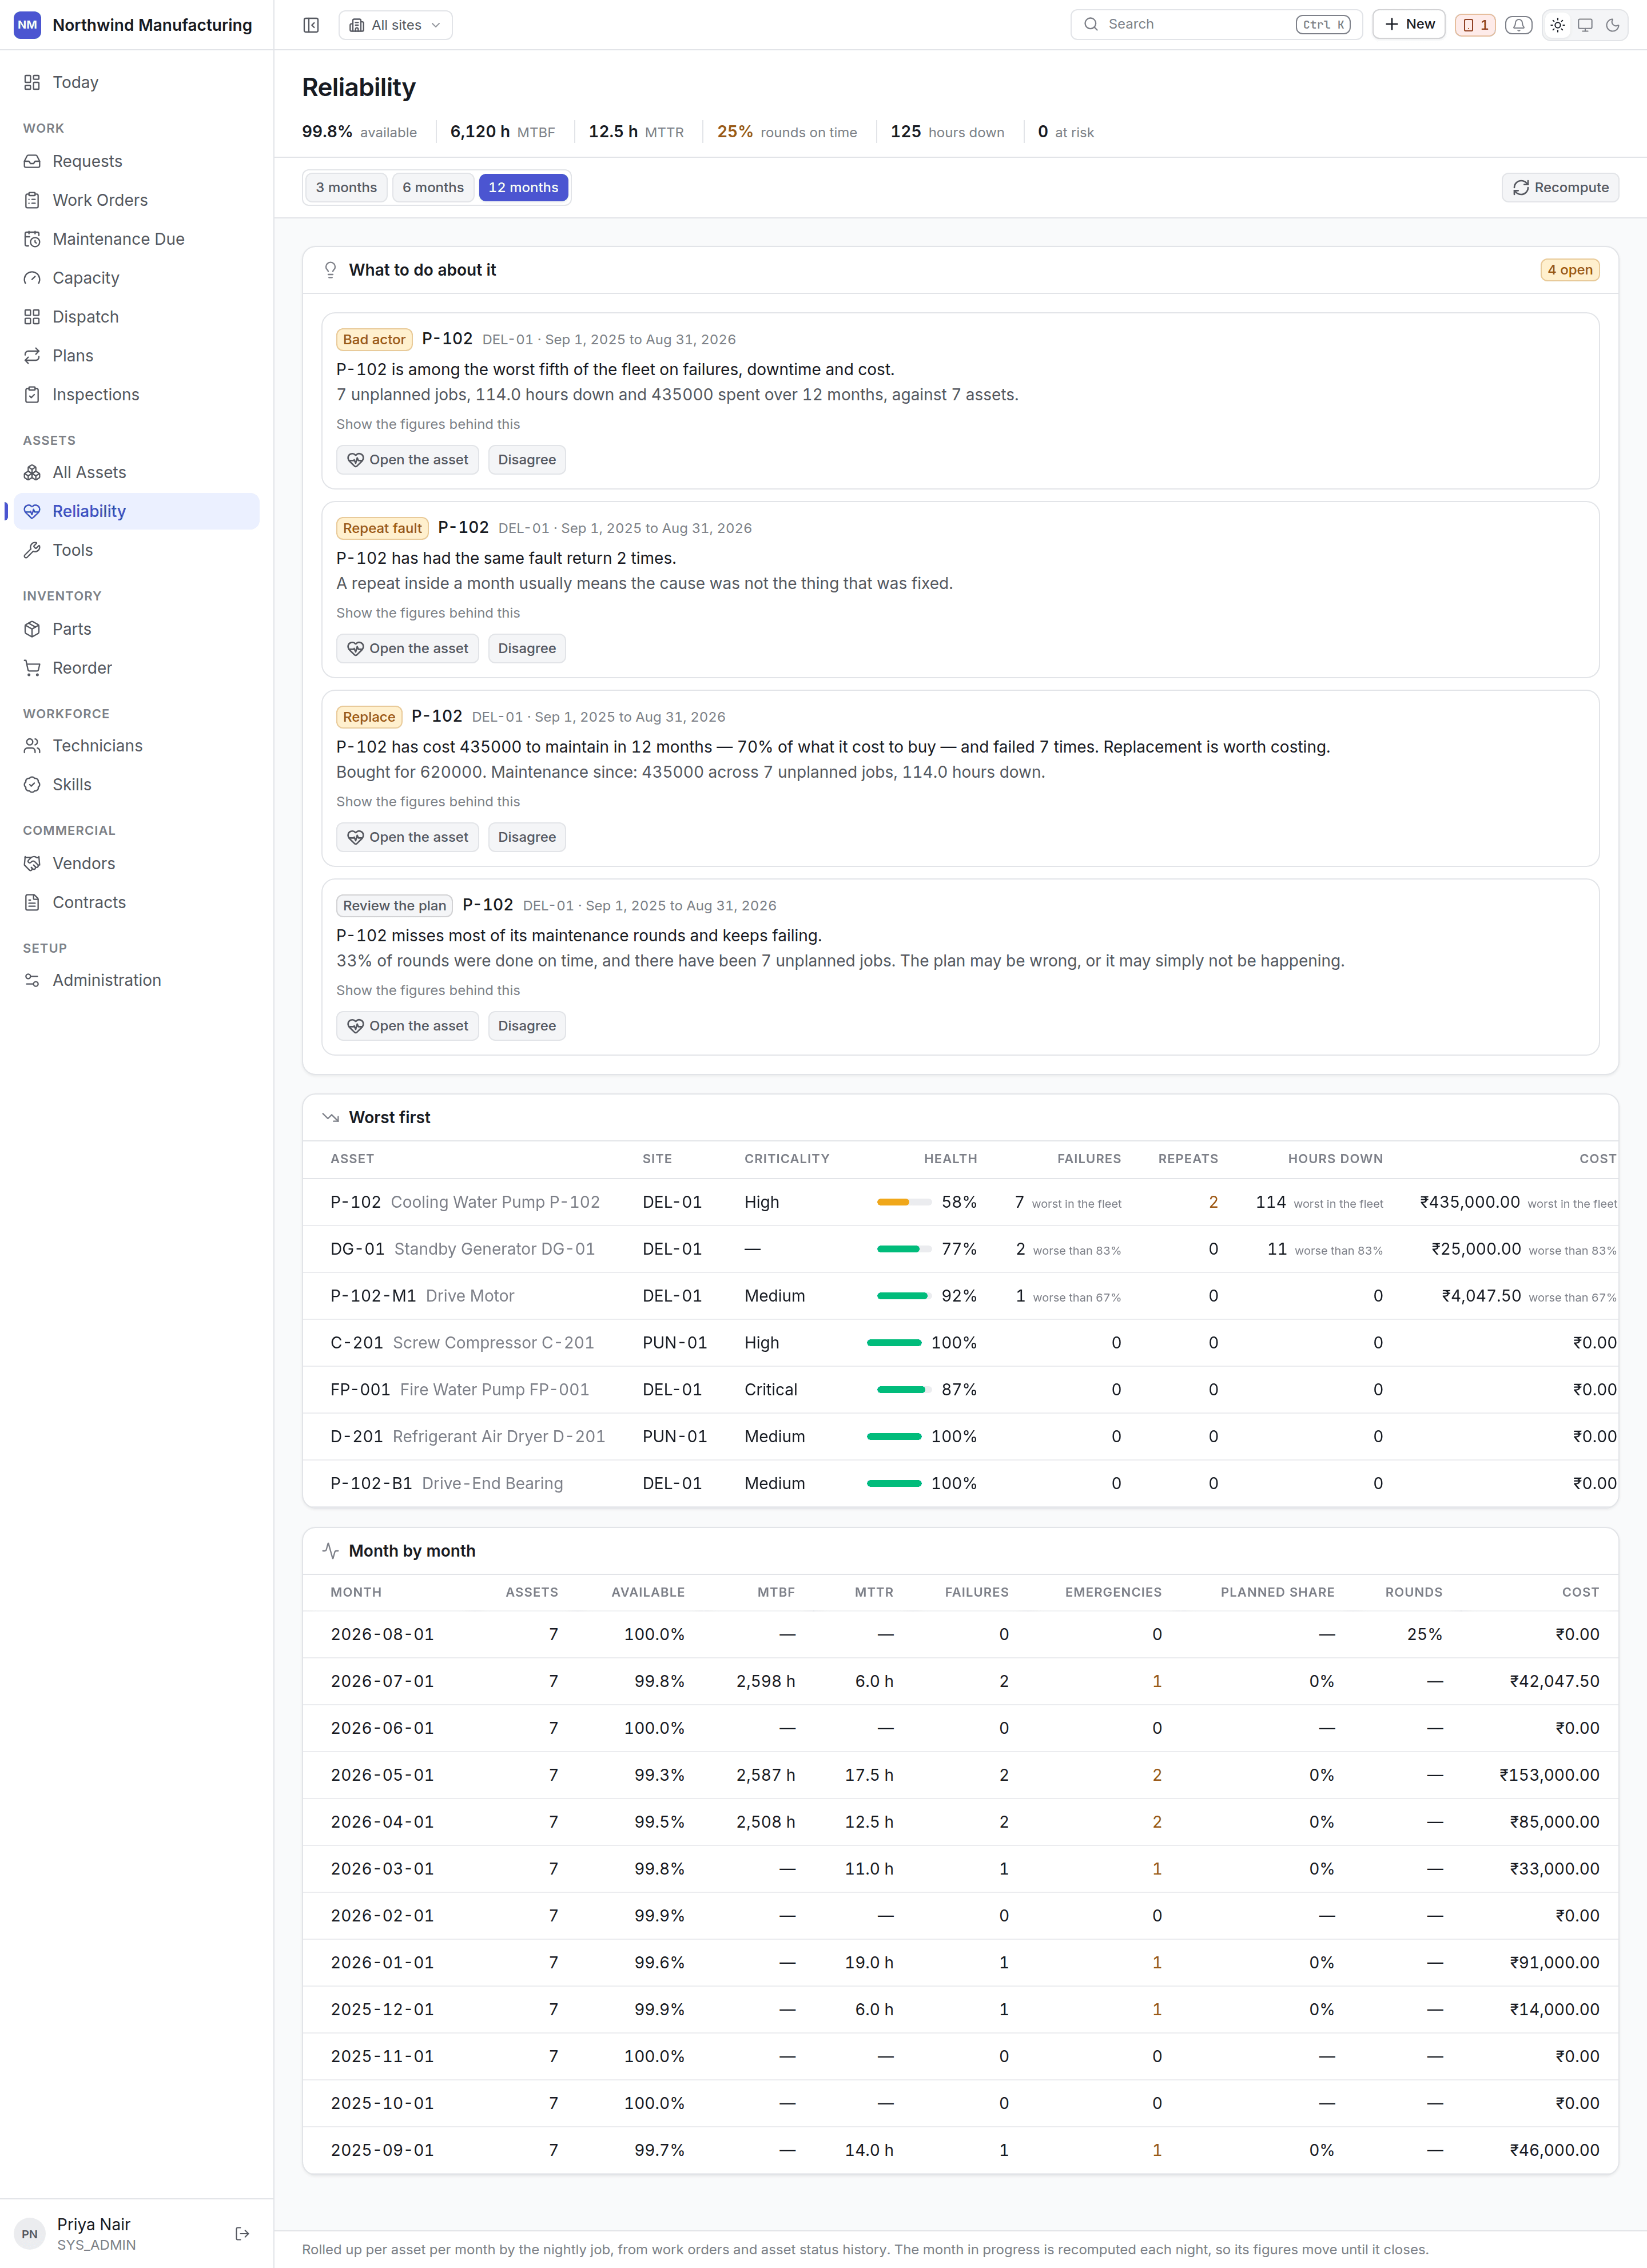
First on the screen even though it is the smallest section, because it is the only part that says anything ought to happen — and therefore the only part you can disagree with. A recommendation reads like an argument:P-102 has cost 435,000 to maintain in twelve months — 70% of what it cost to buy — and failed 7 times. Replacement is worth costing.Each one carries the evidence it was built from. You can accept a recommendation, which records that somebody agreed and what they intend to do, or dismiss it with a reason. Typical recommendations:
An Investigate recommendation is what opens an investigation on
Root cause, which is where the pattern is worked through and the actions that
come out of it are followed until somebody can say whether they worked.
Bad actors
The machines costing you the most, ranked. The percentiles are the point, not decoration. “Seven failures” means nothing until it is “seven failures — worse than 96% of the fleet”. A ranking against the whole fleet is something only the server can compute; a browser holding one page of rows could not. Each row carries failures, downtime hours, maintenance cost, MTBF and health, with the percentile beside each.The trend
Whether the fleet is improving. Availability, MTBF, MTTR, PM compliance and downtime over time. Read over the window rather than the newest month — the current month is a few days old and always reads as a perfect one.The measures
Every figure comes from the same computation the dashboards use. Nothing on this screen is
re-derived in the browser, so two screens never disagree about the same machine.
What feeds it
Reliability is only as good as what is recorded:- Failures on the jobs that fixed them — a repair with no failure teaches nothing.
- Downtime, via the asset being put Down rather than Under Maintenance.
- Costs — labour booked, parts issued.
- Closed work orders. Work left open is work that never reaches these figures.